This should be more simple.
Epidemiology and biostatistics are awash with synonyms and each institution has its own preferred nomenclature to describe the same general concepts. I started this page as a central place to document the various terms by concept. I’ll plan on revisiting and updating over time.
Regression
Fundamentals
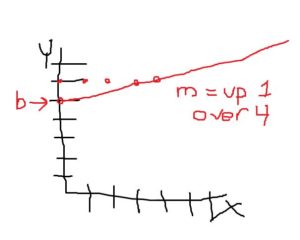
You probably learned the fundamentals of regression in introductory algebra but may not realize it. Remember drawing a graph from a slope-intercept equation? Draw a graph where Y is equal to 1/4x plus 5. (Here is the relevant Khan Academy Algebra I video about this.) You take the general equation:
Y = mx + b
…where Y is the y-axis, m is the slope of the line, and b is where the line crosses the y-axis. The equation you will write is:
Y=1/4x + 5
…and you will draw:
This sounding familiar? When you do a linear regression, you do the same thing. Instead, you regress Y on X, or:
Y = β1x1 + β0
And fitting in the variables here, you want to figure out what a predicted cholesterol level will be for folks by a given age. You would regress cholesterol level on age:
Cholesterol level = β1*Age + β0
Here, x1 is the slope of the line for age and β0 is the intercept on the Y-axis, essentially the same as the b in Y=mx+b. When you run a regression in Stata, you type
regress y x
or here,
regress cholesterol age
Let’s say that Stata spits out something like:
      Source |  xxxxxxxxxxxxxxxxxxxxxxxxxxxx
-------------+------------------------------
       Model |  xxxxxxxxxxxxxxxxxxxxxxxxxxxx
    Residual |  xxxxxxxxxxxxxxxxxxxxxxxxxxxx
-------------+------------------------------
       Total |  xxxxxxxxxxxxxxxxxxxxxxxxxxxx

------------------------------------------------------------------------------
  cholesterol|      coeff       se         t     P>|t|    [95% Conf. Interval]
-------------+----------------------------------------------------------------
         age |     0.500     xxxxxxxx    xxxxx   0.000     0.4000      0.60000
       _cons |     100       xxxxxxxx    xxxxx   0.000     90.000      110.000
------------------------------------------------------------------------------
The β1 coefficient for age is 0.5. The intercept, or β0 is 100. You would interpret this as cholesterol level = 0.5*age in years + 100. You could plot this using your Algebra 1 skills.
Cholesterol = 0.5*age + 100
Or you can substitute in actual numbers. What is the predicted cholesterol at age 50? Answer: 125.
If you want to make it more complex and add more variables to explain cholesterol level, it’s no longer a straight line on a graph, but the concept is the same. A multiple linear regression adds more X variables. You can figure out what a predicted cholesterol level will be for folks by age, sex, and BMI. You would regress cholesterol level on age, sex, and BMI. (You would code sex as 0 or 1, like female = 1 and male = 0.)
Y = β1x1 + β2x2 + β3x3 + β0
Or,
Y = β1*Age + β2*Sex + β3*BMI + β0
You get the idea.
Names of Y and X
This is what irks me. There are so many synonyms for Y and X variables. Here is a chart that I’ll update over time with synonyms seen in the wild.
| Y | = | x |
|---|---|---|
| Dependent | Independent | |
| Outcome | Predictor | |
| Covariate | ||
| Factor | ||
| Exposure variable | ||
| Explanatory variable |