If you like automating your Stata output, you have probably struggled with how to format P-values so they display in a format that is common in journals, namely:
- If P>0.05 and not close to 0.05, P has an equals sign and you round at the hundredth place
- E.g., P=0.2777 becomes P=0.28
- If P is close to 0.05 , P has an equals sign and you round at the ten thousandth place
- E.g., P=0.05033259 becomes P=0.0503
- E.g., P=0.0492823 become P=0.0493
- If well below 0.05 but above 0.001, P has an equals sign and you round at the hundredth place
- E.g., P=0.0028832 becomes P=0.003
- if below 0.001, display as “P<0.001"
- if below 0.0001, display as “P<0.0001"
Here’s a loop that will do that for you. This contains local macros so you need to run it all at once from a do file, not line by line. You’ll need to have grabbed the P-value as a from Stata as a local macro named pval. It will generate a new local macro called pvalue that you need to treat as a string.
local pval 0.05535235 // change me to play around with this
if `pval'>=0.056 {
	local pvalue "P=`: display %3.2f `pval''"
}
if `pval'>=0.044 & `pval'<0.056 {
	local pvalue "P=`: display %5.4f `pval''"
}
if `pval' <0.044 {
	local pvalue "P=`: display %4.3f `pval''"
}
if `pval' <0.001 {
	local pvalue "P<0.001"
}
if `pval' <0.0001 {
	local pvalue "P<0.0001"
}
di "original P is " `pval' ", formatted is " "`pvalue'"
Here’s how you might use it to format the text of a regression coefficient that you put on a figure.
sysuse auto, clear
regress weight mpg
// let's grab the P-value for the mpg
matrix list r(table) //notice that it's at [4,1]
local pval = r(table)[4,1]
if `pval'>=0.056 {
local pvalue "P=`: display %3.2f `pval''"
}
if `pval'>=0.044 & `pval'<0.056 {
local pvalue "P=`: display %5.4f `pval''"
}
if `pval' <0.044 {
local pvalue "P=`: display %4.3f `pval''"
}
if `pval' <0.001 {
local pvalue "P<0.001"
}
if `pval' <0.0001 {
local pvalue "P<0.0001"
}
di "original P is " `pval' ", formatted is " "`pvalue'"
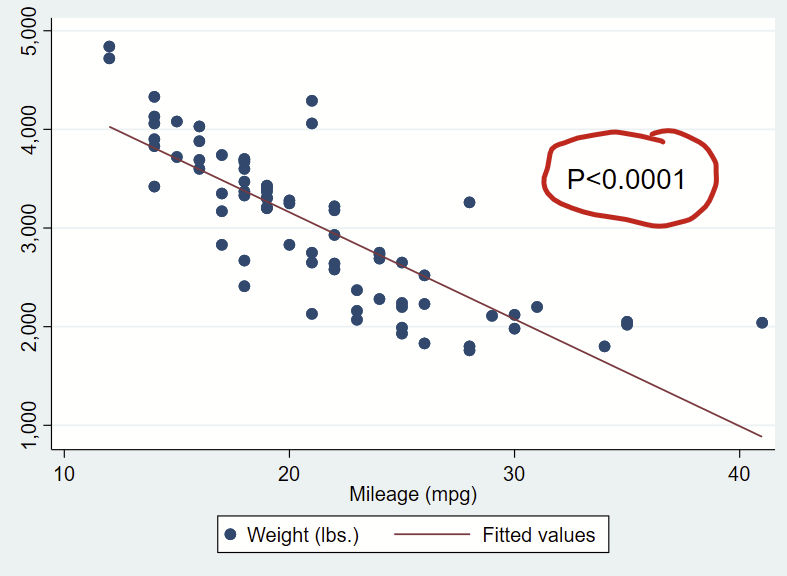
// now make a scatterplot and print out that formatted p-value
twoway ///
(scatter weight mpg) ///
(lfit weight mpg) ///
, ///
text(3500 35 "`pvalue'", size(large))