Stata has some handy built-in features to make boxplots. If you are trying to make a typical boxplot in Stata, go read up on the –graph box– command as described on this post.
I was asked to abstract a boxplot from an old paper and re-render it in Stata.

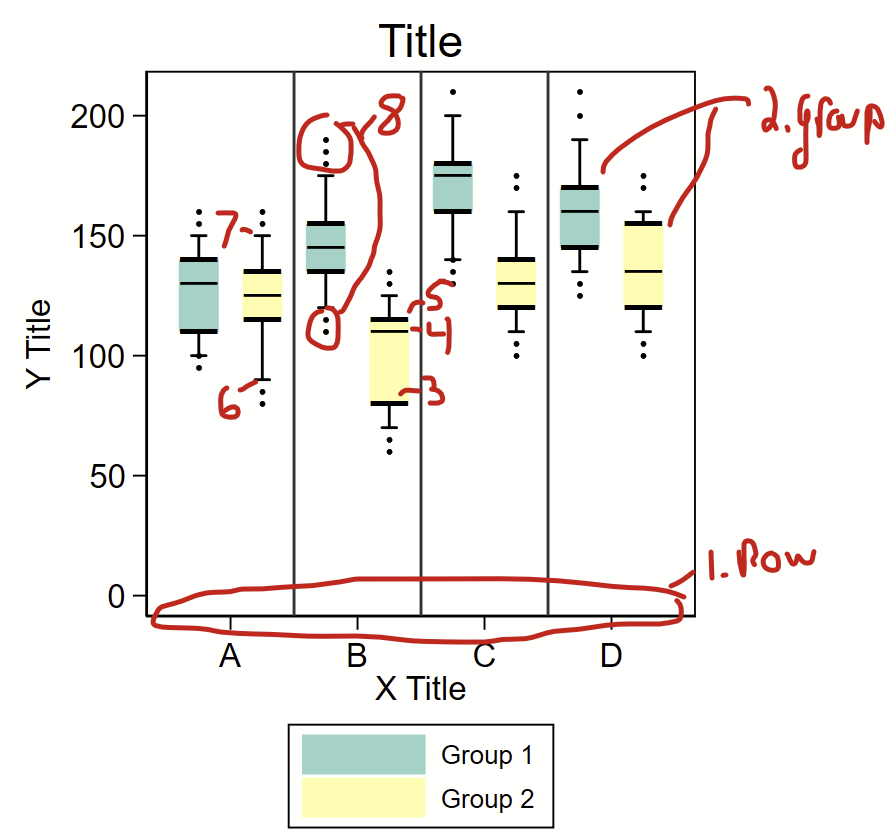
I used the excellent WebPlotDigitizer to abstract the points in these figure. It took me a few rounds of data abstraction to get all of the data. I generated the following variables
- (1) “row” – rows 1-8 — the “A-D” labels on the x axis are offset at 1.5, 3.5, 5.5, and 7.5, respectively,
- (2) “group” – an indicator for group 1 or 2,
- (3-5) “boxlow” “boxmid” and “boxhigh” – the lower, mid, and upper bounds of the box,
- (6-7) “bar1” and “bar2” – the low and upper end of the bars, and
- (8) “dot” – extreme values.
I used “input” at the top of a do file to load these data. The colors were taken from ColorBrewer2. The “box” are just really wide pcspike lines with overlaying horizontal bars as floating text boxes to indicate the bottom, median, and top of the box. One problem is the placement of the horizontal lines on and above/below the box itself, since the “―” ascii character isn’t perfectly in the middle of the vertical space that is used to render it. To get around this, I included an offset value that could be modified to shift these lines up and down so they lined up with the boxes. The “whiskers” are an rcap. The extreme values are just scatterplot dots.
Code to make this follows, data here are fake.
// abstracted with this: https://apps.automeris.io/wpd/
clear all

input row group boxlow boxmid boxhigh bar1 bar2 dot
1 1 110 130 140 100 150 .
2 2 115 125 135 90 150 .
3 1 135 145 155 120 175 .
4 2 80 110 115 70 125 .
5 1 160 175 180 140 200 .
6 2 120 130 140 110 160 .
7 1 145 160 170 135 190 .
8 2 120 135 155 110 160 .
1 . . . . . . 95
1 . . . . . . 100
1 . . . . . . 155
1 . . . . . . 160
2 . . . . . . 80
2 . . . . . . 85
2 . . . . . . 155
2 . . . . . . 160
3 . . . . . . 110
3 . . . . . . 115
3 . . . . . . 180
3 . . . . . . 185
3 . . . . . . 190
4 . . . . . . 60
4 . . . . . . 65
4 . . . . . . 130
4 . . . . . . 135
5 . . . . . . 130
5 . . . . . . 135
5 . . . . . . 210
5 . . . . . . 140
6 . . . . . . 100
6 . . . . . . 105
6 . . . . . . 170
6 . . . . . . 175
7 . . . . . . 125
7 . . . . . . 130
7 . . . . . . 200
7 . . . . . . 210
8 . . . . . . 100
8 . . . . . . 105
8 . . . . . . 170
8 . . . . . . 175
end


// offset to move the bars on the box up or down on Y-axis,
// tweak as needed:
local offset = 2

set scheme s1mono

twoway ///
(rcap bar1 bar2 row, vert lcolor(black)) /// code for 95% CI
(pcspike boxlow row boxhigh row if group==1, vert lwidth(vvvthick) lcolor("141 211 199")) ///
(pcspike boxlow row boxhigh row if group==2, vert lwidth(vvvthick) lcolor("255 255 179")) ///
(scatter dot row , mcolor(black) msymbol(o) msize(tiny)) ///
, ///
text(`=boxmid[1]+`offset'' 1 "―", placement(c) size(medlarge) color(black)) ///
text(`=boxlow[1]+`offset'' 1 "{bf:―}", placement(c) size(medlarge) color(black)) ///
text(`=boxhigh[1]+`offset'' 1 "{bf:―}", placement(c) size(medlarge) color(black)) ///
///
text(`=boxmid[2]+`offset'' 2 "―", placement(c) size(medlarge) color(black)) ///
text(`=boxlow[2]+`offset'' 2 "{bf:―}", placement(c) size(medlarge) color(black)) ///
text(`=boxhigh[2]+`offset'' 2 "{bf:―}", placement(c) size(medlarge) color(black)) ///
///
text(`=boxmid[3]+`offset'' 3 "―", placement(c) size(medlarge) color(black)) ///
text(`=boxlow[3]+`offset'' 3 "{bf:―}", placement(c) size(medlarge) color(black)) ///
text(`=boxhigh[3]+`offset'' 3 "{bf:―}", placement(c) size(medlarge) color(black)) ///
///
text(`=boxmid[4]+`offset'' 4 "―", placement(c) size(medlarge) color(black)) ///
text(`=boxlow[4]+`offset'' 4 "{bf:―}", placement(c) size(medlarge) color(black)) ///
text(`=boxhigh[4]+`offset'' 4 "{bf:―}", placement(c) size(medlarge) color(black)) ///
///
text(`=boxmid[5]+`offset'' 5 "―", placement(c) size(medlarge) color(black)) ///
text(`=boxlow[5]+`offset'' 5 "{bf:―}", placement(c) size(medlarge) color(black)) ///
text(`=boxhigh[5]+`offset'' 5 "{bf:―}", placement(c) size(medlarge) color(black)) ///
///
text(`=boxmid[6]+`offset'' 6 "―", placement(c) size(medlarge) color(black)) ///
text(`=boxlow[6]+`offset'' 6 "{bf:―}", placement(c) size(medlarge) color(black)) ///
text(`=boxhigh[6]+`offset'' 6 "{bf:―}", placement(c) size(medlarge) color(black)) ///
///
text(`=boxmid[7]+`offset'' 7 "―", placement(c) size(medlarge) color(black)) ///
text(`=boxlow[7]+`offset'' 7 "{bf:―}", placement(c) size(medlarge) color(black)) ///
text(`=boxhigh[7]+`offset'' 7 "{bf:―}", placement(c) size(medlarge) color(black)) ///
///
text(`=boxmid[8]+`offset'' 8 "―", placement(c) size(medlarge) color(black)) ///
text(`=boxlow[8]+`offset'' 8 "{bf:―}", placement(c) size(medlarge) color(black)) ///
text(`=boxhigh[8]+`offset'' 8 "{bf:―}", placement(c) size(medlarge) color(black)) ///
///
legend(order(2 "Group 1" 3 "Group 2") row(2) size(small)) ///
scale(1.3) ///
///
xtitle("X Title") ///
ytitle("Y Title") ///
///
title("Title") ///
xsize(5) ///
ysize(6) ///
yla(0(50)200, angle(0)) ///
xscale(r(.5 8.5)) ///
xla(1.5 "A" 3.5 "B" 5.5 "C" 7.5 "D") ///
xline(2.5 4.5 6.5)