Note: this code probably doesn’t work anymore with changes in the NY Times database. I’m keeping it here for historical purposes (4/22/2022).
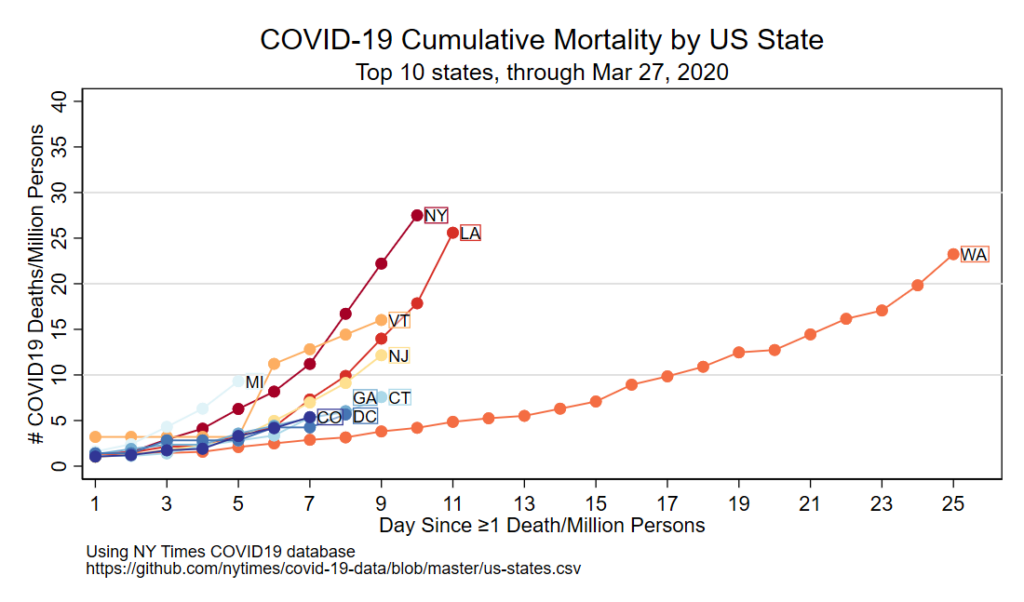
Here’s the figure!
Code follows
Comments are in-line below. Some unique strategies in this code:
- This will automatically download the latest NY Times dataset, but the date of “last day of follow-up” needs to be specifically defined. I find that the label locations need to be tweaked every day, and this process isn’t simple to automate.
- The colors are defined by global macros once and are applied multiple times by calling those macros.
- Text blocks are rendered next to the last day of follow-up with a translucent white background and non-translucent colored border that matches the dotted line.
- Twitter figures should be output at 1100 x 628, per this blog. This script does that. Twitter clips images that aren’t this size.
****************************************************
// step 1: download  and save NY times database
****************************************************
version 15.1 // my version of Stata when this was written

import delimited using ///
"https://raw.githubusercontent.com/nytimes/covid-19-data/master/us-states.csv", ///
varn(1) clear

// Now make the date a stata date. Load this handy date-fixing program
// I wrote. The syntax is 'fixdate [variable name] [mdy, ymd, etc]
do https://www.uvm.edu/~tbplante/fixdate_v1_0.do
fixdate date ymd
// rename state to state_fullname
rename state state_fullname
****************************************************
// step 2: keep 50 states+DC, apply abbreviations
****************************************************
gen state=" "
replace state="AL" if state_fullname=="Alabama"
replace state="AK" if state_fullname=="Alaska"
replace state="AZ" if state_fullname=="Arizona"
replace state="AR" if state_fullname=="Arkansas"
replace state="CA" if state_fullname=="California"
replace state="CO" if state_fullname=="Colorado"
replace state="CT" if state_fullname=="Connecticut"
replace state="DE" if state_fullname=="Delaware"
replace state="FL" if state_fullname=="Florida"
replace state="GA" if state_fullname=="Georgia"
replace state="HI" if state_fullname=="Hawaii"
replace state="ID" if state_fullname=="Idaho"
replace state="IL" if state_fullname=="Illinois"
replace state="IN" if state_fullname=="Indiana"
replace state="IA" if state_fullname=="Iowa"
replace state="KS" if state_fullname=="Kansas"
replace state="KY" if state_fullname=="Kentucky"
replace state="LA" if state_fullname=="Louisiana"
replace state="ME" if state_fullname=="Maine"
replace state="MD" if state_fullname=="Maryland"
replace state="MA" if state_fullname=="Massachusetts"
replace state="MI" if state_fullname=="Michigan"
replace state="MN" if state_fullname=="Minnesota"
replace state="MS" if state_fullname=="Mississippi"
replace state="MO" if state_fullname=="Missouri"
replace state="MT" if state_fullname=="Montana"
replace state="NE" if state_fullname=="Nebraska"
replace state="NV" if state_fullname=="Nevada"
replace state="NH" if state_fullname=="New Hampshire"
replace state="NJ" if state_fullname=="New Jersey"
replace state="NM" if state_fullname=="New Mexico"
replace state="NY" if state_fullname=="New York"
replace state="NC" if state_fullname=="North Carolina"
replace state="ND" if state_fullname=="North Dakota"
replace state="OH" if state_fullname=="Ohio"
replace state="OK" if state_fullname=="Oklahoma"
replace state="OR" if state_fullname=="Oregon"
replace state="PA" if state_fullname=="Pennsylvania"
replace state="RI" if state_fullname=="Rhode Island"
replace state="SC" if state_fullname=="South Carolina"
replace state="SD" if state_fullname=="South Dakota"
replace state="TN" if state_fullname=="Tennessee"
replace state="TX" if state_fullname=="Texas"
replace state="UT" if state_fullname=="Utah"
replace state="VT" if state_fullname=="Vermont"
replace state="VA" if state_fullname=="Virginia"
replace state="WA" if state_fullname=="Washington"
replace state="WV" if state_fullname=="West Virginia"
replace state="WI" if state_fullname=="Wisconsin"
replace state="WY" if state_fullname=="Wyoming"
replace state="DC" if state_fullname=="District of Columbia"
drop if state==" " // drop guam, VI, PR. would be reasonable to add them back
// would need to get their populations for the list below.
****************************************************
// step 3: apply population by state
****************************************************
// ref:
// https://www.census.gov/data/tables/time-series/demo/popest/2010s-state-total.html
// http://www2.census.gov/programs-surveys/popest/datasets/2010-2019/national/totals/nst-est2019-alldata.csv?#
gen statepop=.
replace statepop=4903185 if state=="AL"
replace statepop=731545 if state=="AK"
replace statepop=7278717 if state=="AZ"
replace statepop=3017804 if state=="AR"
replace statepop=39512223 if state=="CA"
replace statepop=5758736 if state=="CO"
replace statepop=3565287 if state=="CT"
replace statepop=973764 if state=="DE"
replace statepop=705749 if state=="DC"
replace statepop=21477737 if state=="FL"
replace statepop=10617423 if state=="GA"
replace statepop=1415872 if state=="HI"
replace statepop=1787065 if state=="ID"
replace statepop=12671821 if state=="IL"
replace statepop=6732219 if state=="IN"
replace statepop=3155070 if state=="IA"
replace statepop=2913314 if state=="KS"
replace statepop=4467673 if state=="KY"
replace statepop=4648794 if state=="LA"
replace statepop=1344212 if state=="ME"
replace statepop=6045680 if state=="MD"
replace statepop=6892503 if state=="MA"
replace statepop=9986857 if state=="MI"
replace statepop=5639632 if state=="MN"
replace statepop=2976149 if state=="MS"
replace statepop=6137428 if state=="MO"
replace statepop=1068778 if state=="MT"
replace statepop=1934408 if state=="NE"
replace statepop=3080156 if state=="NV"
replace statepop=1359711 if state=="NH"
replace statepop=8882190 if state=="NJ"
replace statepop=2096829 if state=="NM"
replace statepop=19453561 if state=="NY"
replace statepop=10488084 if state=="NC"
replace statepop=762062 if state=="ND"
replace statepop=11689100 if state=="OH"
replace statepop=3956971 if state=="OK"
replace statepop=4217737 if state=="OR"
replace statepop=12801989 if state=="PA"
replace statepop=1059361 if state=="RI"
replace statepop=5148714 if state=="SC"
replace statepop=884659 if state=="SD"
replace statepop=6829174 if state=="TN"
replace statepop=28995881 if state=="TX"
replace statepop=3205958 if state=="UT"
replace statepop=623989 if state=="VT"
replace statepop=8535519 if state=="VA"
replace statepop=7614893 if state=="WA"
replace statepop=1792147 if state=="WV"
replace statepop=5822434 if state=="WI"
replace statepop=578759 if state=="WY"
****************************************************
// step 4: make daily death count per capita
****************************************************
// now make variables for cases and deaths per capita in each state (per million persons)
gen statepopave_deaths = (deaths/statepop) *1000000

****************************************************
// step 5: make a variable for when the death rate is
// >=1/1,000,000 people in each state, and count days
// following that
****************************************************
sort state date
gen days_1_death=.
replace days_1_death=0 if statepopave_deaths < 1
replace days_1_death=1 if (statepopave_deaths >= 1 & statepopave_deaths[_n-1] <1 ) ///
& (state==state[_n-1])
//
replace days_1_death = days_1_death[_n-1]+1 if state==state[_n-1] ///
& days_1_death[_n-1]!=0
****************************************************
// step 6: save database
****************************************************

save nytimes_state_fu.dta, replace

****************************************************
// step 7: specify last day of follow-up and
// get rank of states and location
// to put state names in x,y location for the
// last day of follow-up
****************************************************
// reload
use nytimes_state_fu.dta, clear

// ****THIS NEEDS TO BE EDITED EVERY DAY.****
// Set the final date of follow-up.
// as of today (3/29/2020), 3/27/2020 is the most
// recent day of data in the NY times database.
//
// This is intentionally not automated because I want to manually adjust
// labels and range each time.
global month Mar // needs to be in 3 letter abbreviation for month
global date 27 // 2 number day in month

// drop any day beyond the specified date
drop if date>date("${date}${month}2020", "DMY")

// this global will make the x axis 1 day longer than the current follow-up
sum days_1_death
global maxdate = r(max)+1

// actually determine the order of states on the last day of follow-up,
// which is how the labels and colors are applied.
// need to drop all but the last date of follow-up
keep if date==date("${date}${month}2020", "DMY")
gsort -statepopave_deaths // sort in reverse order
gen n=_n // make variable that contains order based upon sort
drop if n >10 // drop those not in the top 10

// need to figure out where to put the labels of state names
// this loop plucks out the state name and x&y coordinates for the last
// day of follow-up.
// it also prints the order of the states.
foreach x in 1 2 3 4 5 6 7 8 9 10 {
global statename`x'=state[`x'] // pull state name
global datecount`x' = days_1_death[`x'] + 0.2 // x axis, need to offset by 0.2
//                                      so the label isn't on top of the dot
global statedeath`x' = statepopave_deaths[`x'] // yaxis

di "State rank #`x': ${statename`x'}"
di "(x axis) # of days: ${datecount`x'}"
di "(y axis) deaths/million: ${statedeath`x'}"
di " "
}
//
// The labels might overlap each other. This you can manually readjust the
// location on the y axis following here. This won't alter data in the
// figure, just the location of the labels.

global statedeath1 = ${statedeath1} // don't need to move label
global statedeath2 = ${statedeath2} // don't need to move label
global statedeath3 = ${statedeath3}  // don't need to move label
global statedeath4 = ${statedeath4}  // don't need to move label
global statedeath5 = ${statedeath5}  // don't need to move label
global statedeath6 = ${statedeath6}  // don't need to move label
global statedeath7 = ${statedeath7}  // don't need to move label
global statedeath8 = ${statedeath8}+1.5 // move GA up on y axis
global statedeath9 = ${statedeath8}-2 // move DC down on y axis
global statedeath10 = ${statedeath10} // don't need to move label
****************************************************
// step 8: specify colors, make figure, save figure
// in size compatible with twitter
****************************************************

// reload the full dataset
use nytimes_state_fu.dta, replace
// drop any day beyond the specified date.
drop if date>date("${date}${month}2020", "DMY")

// I like the s1mono scheme. Default stata theme is ugly.
set scheme s1mono
// colors for these states, taken from colorbrewer website
// ref: https://colorbrewer2.org/#type=diverging&scheme=RdYlBu&n=10
// these are RGB triads
global color1 165 0 38
global color2 215 48 39
global color3 244 109 67
global color4 253 174 97
global color5 254 224 144
global color6 224 243 248
global color7 171 217 233
global color8 116 173 209
global color9 69 117 180
global color10 49 54 149

// the actual graphic!
// note: you need to put 'sort' after the 'twoway scatter' command so the line doesn't loop back around.
twoway ///
(scatter statepopave_deaths days_1_death if state=="${statename1}" & days_1_death>=1 & date>=1, ///
mcolor("${color1}") msymbol(O) lpattern(solid) lcolor("${color1}") connect(L) sort) ///
(scatter statepopave_deaths days_1_death if state=="${statename2}" & days_1_death>=1 & date>=1, ///
mcolor("${color2}") msymbol(O) lpattern(solid) lcolor("${color2}") connect(L) sort) ///
(scatter statepopave_deaths days_1_death if state=="${statename3}" & days_1_death>=1 & date>=1, ///
mcolor("${color3}") msymbol(O) lpattern(solid) lcolor("${color3}") connect(L) sort) ///
(scatter statepopave_deaths days_1_death if state=="${statename4}" & days_1_death>=1 & date>=1, ///
mcolor("${color4}") msymbol(O) lpattern(solid) lcolor("${color4}") connect(L) sort) ///
(scatter statepopave_deaths days_1_death if state=="${statename5}" & days_1_death>=1 & date>=1, ///
mcolor("${color5}") msymbol(O) lpattern(solid) lcolor("${color5}") connect(L) sort) ///
(scatter statepopave_deaths days_1_death if state=="${statename6}" & days_1_death>=1 & date>=1, ///
mcolor("${color6}") msymbol(O) lpattern(solid) lcolor("${color6}") connect(L) sort) ///
(scatter statepopave_deaths days_1_death if state=="${statename7}" & days_1_death>=1 & date>=1, ///
mcolor("${color7}") msymbol(O) lpattern(solid) lcolor("${color7}") connect(L) sort) ///
(scatter statepopave_deaths days_1_death if state=="${statename8}" & days_1_death>=1 & date>=1, ///
mcolor("${color8}") msymbol(O) lpattern(solid) lcolor("${color8}") connect(L) sort) ///
(scatter statepopave_deaths days_1_death if state=="${statename9}" & days_1_death>=1 & date>=1, ///
mcolor("${color9}") msymbol(O) lpattern(solid) lcolor("${color9}") connect(L) sort) ///
(scatter statepopave_deaths days_1_death if state=="${statename10}" & days_1_death>=1 & date>=1, ///
mcolor("${color10}") msymbol(O) lpattern(solid) lcolor("${color10}") connect(L) sort) ///
, ///
yline(30, lcolor(gs14)) ///will need at add additional horizontal lines as figure grows
yline(20, lcolor(gs14)) ///
yline(10, lcolor(gs14)) ///
title("COVID-19 Cumulative Mortality by US State") ///
t1title("Top 10 states, through $month $date, 2020") ///
xla(1(2)$maxdate) ///
yla(0(5)40) ///
yti("# COVID19 Deaths/Million Persons") ///
xti("Day Since ≥1 Death/Million Persons") ///
legend(off) ///
/// the following will render each label with a surrounding box that's the same color as the line.
text(${statedeath1} ${datecount1} "${statename1}", ///
size(small) place(e) just(left) box bcolor(white%40) lcolor("${color1}%100") lstyle(solid) lwidth(thin)) ///
text(${statedeath2} ${datecount2} "${statename2}", ///
size(small) place(e) just(left) box bcolor(white%40) lcolor("${color2}%100") lstyle(solid) lwidth(thin)) ///
text(${statedeath3} ${datecount3} "${statename3}", ///
size(small) place(e) just(left) box bcolor(white%40) lcolor("${color3}%100") lstyle(solid) lwidth(thin)) ///
text(${statedeath4} ${datecount4} "${statename4}", ///
size(small) place(e) just(left) box bcolor(white%40) lcolor("${color4}%100") lstyle(solid) lwidth(thin)) ///
text(${statedeath5} ${datecount5} "${statename5}", ///
size(small) place(e) just(left) box bcolor(white%40) lcolor("${color5}%100") lstyle(solid) lwidth(thin)) ///
text(${statedeath6} ${datecount6} "${statename6}", ///
size(small) place(e) just(left) box bcolor(white%40) lcolor("${color6}%100") lstyle(solid) lwidth(thin)) ///
text(${statedeath7} ${datecount7} "${statename7}", ///
size(small) place(e) just(left) box bcolor(white%40) lcolor("${color7}%100") lstyle(solid) lwidth(thin)) ///
text(${statedeath8} ${datecount8} "${statename8}", ///
size(small) place(e) just(left) box bcolor(white%40) lcolor("${color8}%100") lstyle(solid) lwidth(thin)) ///
text(${statedeath9} ${datecount9} "${statename9}", ///
size(small) place(e) just(left) box bcolor(white%40) lcolor("${color9}%100") lstyle(solid) lwidth(thin)) ///
text(${statedeath10} ${datecount10} "${statename10}", ///
size(small) place(e) just(left) box bcolor(white%40) lcolor("${color10}%100") lstyle(solid) lwidth(thin)) ///
caption("Using NY Times COVID19 database"  ///
"https://github.com/nytimes/covid-19-data/blob/master/us-states.csv",  ///
size(small)) ///
xsize(15.3) ysize(9.0)
// twitter default width & height is 1100x628 pixels.
//This last line sets the corresponding height and width in inches using 72 dpi.

graph export "COVID_mortality_2020_${month}_${date}_continuous.png", replace width(1100)
// width(1100) sets the output to be default width on twitter, or 1100 dpi.