I recently made these two figures with a Stata do file that (A) generates some fake data, (B) plots the data overall with a fitted line, (C) plots each participant individually with fitted line, and (D) merges these four individual plots into one overall plot. One tricky piece of this was to get the –graph combine– command to get the four figures to be square, I had to fiddle with the –ysize– to get them to be square. I had originally tried using the –aspect– option, but it builds in lots of white space to between the figures. this way seemed to work.

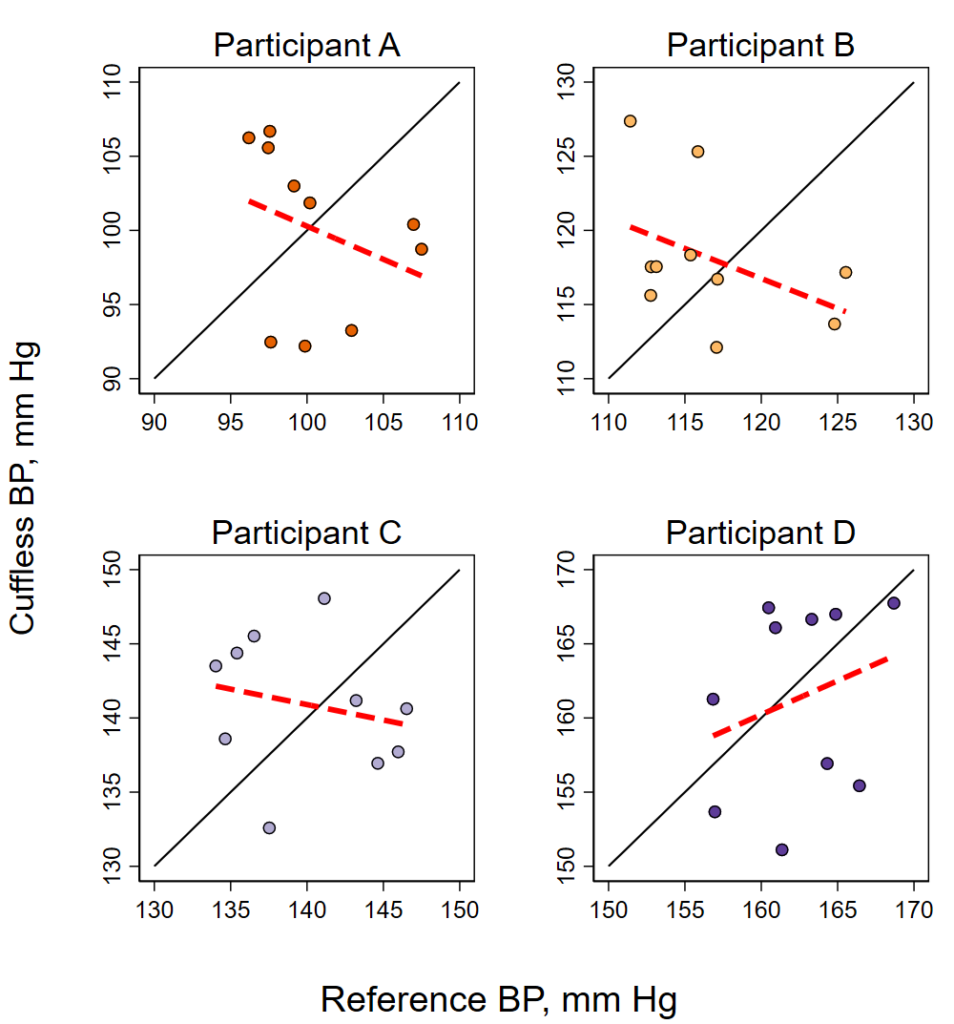
Here’s the Stata code to make the above figures.
************************
*****clear data/graphs**
****set graph schemes***
************************
clear
graph drop _all
set scheme s1mono

************************
*****generate data******
************************
set seed 8675309
// generate 40 random values
set obs 40
//...called x and y that range from - to +9
gen y = runiform(-9,9)
gen x = runiform(-9,9)
// now make an indicator for each grouping of 10
gen n =.
replace n= 1 if _n>=0 & _n<=10
replace n= 2 if _n>10 & _n<=20replace n= 3 if _n>20 & _n<=30replace n= 4 if _n>30 & _n<=40// now for each successive 10 rows, add 100, 120, 140, and 160
replace y = y+100 if n==1
replace x = x+100 if n==1
replace y = y+120 if n==2
replace x= x+120 if n==2
replace y= y+140 if n==3
replace x= x+140 if n==3
replace y= y+160 if n==4
replace x= x+160 if n==4
************************
*****single figure******
************************
twoway ///
/// line of unity (45 degree line):
(function y = x, ra(90 170) clpat(solid) clwidth(medium) clcolor(black)) ///
/// line of fit:
(lfit y x, lcolor(red) lpattern(dash) lwidth(thick)) ///
/// dots for each group, using colors from colorbrewer2
(scatter y x if n==1, mcolor("230 97 1") msymbol(O) mlcolor(black)) ///
(scatter y x if n==2, mcolor("253 184 99") msymbol(O) mlcolor(black)) ///
(scatter y x if n==3, mcolor("178 171 210") msymbol(O) mlcolor(black)) ///
(scatter y x if n==4, mcolor("94 60 153") msymbol(O) mlcolor(black)) ///
, ///
/// force size:
ysize(4) xsize(4) ///
/// axis titles and rows:
xtitle("Reference BP, mm Hg") ///
ytitle("Cuffless BP, mm Hg") ///
xla(90(20)170) ///
yla(90(20)170) ///
legend(off) ///
/// labels:
text(102 109 "←Participant A", placement(e)) ///
text(119 127 "←Participant B", placement(e)) ///
text(142 135 "Participant C→", placement(w)) ///
text(160 154 "Participant D→", placement(w))
/// export figure:
graph export figure1av2.png, replace width(1000)


************************
***four-piece figures***
*****to merge***********
************************
twoway ///
(function y = x if n==1, ra(90 110) clpat(solid) clwidth(medium) clcolor(black)) ///
(lfit y x if n==1, lcolor(red) lpattern(dash) lwidth(thick)) ///
(scatter y x if n==1, mcolor("230 97 1") msymbol(O) mlcolor(black)) ///
, ///
title("Participant A") ///
xtitle(" ") ///
ytitle(" ") ///
yla(90(5)110) ///
xla(90(5)110) ///
legend(off) ///
name(figure1b1)

twoway ///
(function y = x if n==2, ra(110 130) clpat(solid) clwidth(medium) clcolor(black)) ///
(lfit y x if n==2, lcolor(red) lpattern(dash) lwidth(thick)) ///
(scatter y x if n==2, mcolor("253 184 99") msymbol(O) mlcolor(black)) ///
, ///
title("Participant B") ///
xtitle(" ") ///
ytitle(" ") ///
yla(110(5)130) ///
xla(110(5)130) ///
legend(off) ///
name(figure1b2)

twoway ///
(function y = x if n==3, ra(130 150) clpat(solid) clwidth(medium) clcolor(black)) ///
(lfit y x if n==3, lcolor(red) lpattern(dash) lwidth(thick)) ///
(scatter y x if n==3, mcolor("178 171 210") msymbol(O) mlcolor(black)) ///
, ///
title("Participant C") ///
xtitle(" ") ///
ytitle(" ") ///
yla(130(5)150) ///
xla(130(5)150) ///
legend(off) ///
name(figure1b3)

twoway ///
(function y = x if n==4, ra(150 170) clpat(solid) clwidth(medium) clcolor(black)) ///
(lfit y x if n==4, lcolor(red) lpattern(dash) lwidth(thick)) ///
(scatter y x if n==4, mcolor("94 60 153") msymbol(O) mlcolor(black)) ///
, ///
title("Participant D") ///
xtitle(" ") ///
ytitle(" ") ///
yla(150(5)170) ///
xla(150(5)170) ///
legend(off) ///
name(figure1b4)

***********************
***combine figures*****
***********************
graph combine figure1b1 figure1b2 figure1b3 figure1b4 /*figure1b5*/, ///
b1title("Reference BP, mm Hg") ///
l1title("Cuffless BP, mm Hg") ///
/// this forces the four scatterplots to be the same height/width
/// details here:
/// https://www.stata.com/statalist/archive/2013-07/msg00842.html
cols(2) iscale(.7273) ysize(5.9) graphregion(margin(zero))

/// export to figure
graph export figure1bv2.png, replace width(1000)