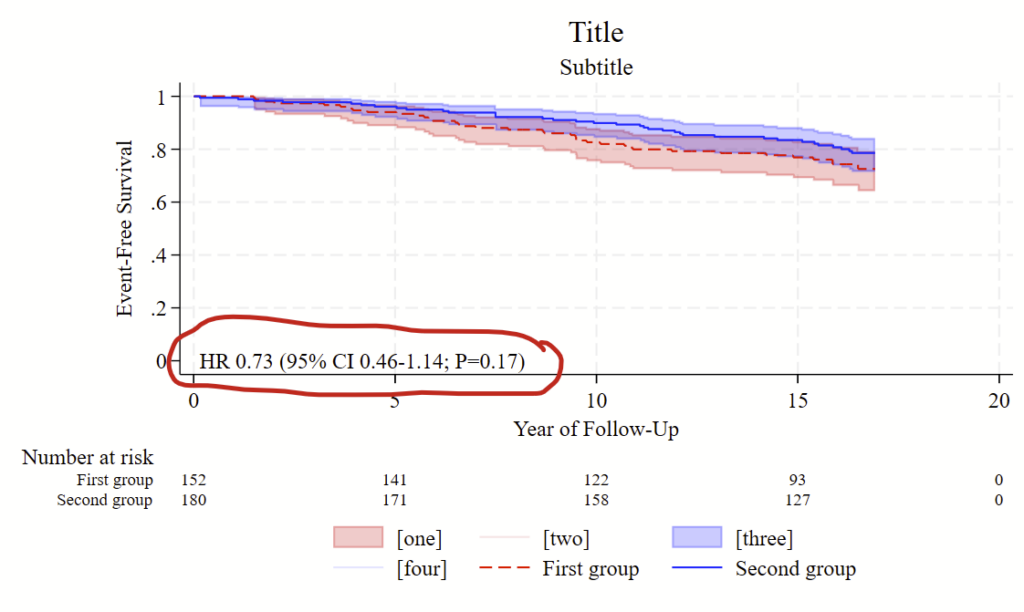
I recently made a figure that estimates a hazard ratio and renders it right on top of a Kaplan Meier curve in Stata. Here’s some example code to make this.
Good luck!
// Load example dataset. I got this from the --help stset-- file
webuse diet, clear

// First, stset the data.
stset dox /// dox is the event or censor date
, ///
failure(fail) /// "fail" is the failure vs censor variable
scale(365.25)


// Next, estimate a cox ph model by "hienergy"
stcox hienergy
// now grab the bits from output of this
local hrb=r(table)[1,1]
local hrlo=r(table)[5,1]
local hrhi=r(table)[6,1]
local pval = r(table)[4,1]
// now format the p-value so it's pretty
if `pval'>=0.056 {
	local pvalue "P=`: display %3.2f `pval''"
}
if `pval'>=0.044 & `pval'<0.056 {
	local pvalue "P=`: display %5.4f `pval''"
}
if `pval' <0.044 {
	local pvalue "P=`: display %4.3f `pval''"
}
if `pval' <0.001 {
	local pvalue "P<0.001"
}
if `pval' <0.0001 {
	local pvalue "P<0.0001"
}

di "original P is " `pval' ", formatted is " "`pvalue'"
di "HR " %4.2f `hrb' " (95% CI " %4.2f `hrlo' "-" %4.2f `hrhi' "; `pvalue')"

// Now make a km plot. this example uses CIs
sts graph ///
, ///
survival ///
by(hienergy) ///
plot1opts(lpattern(dash) lcolor(red)) /// options for line 1
plot2opts(lpattern(solid) lcolor(blue)) /// options for line 2
ci /// add CIs
ci1opts(color(red%20)) /// options for CI 1
ci2opts(color(blue%20)) /// options for CI 2
/// Following this is the legend, placed in the 6 O'clock position.
/// Only graphics 5 and 6 are needed, but all 6 are shown so you
/// see that other bits that can show up in the legend. Delete
/// everything except for 5 and 6 to hide the rest of the legend components
legend(order(1 "[one]" 2 "[two]" 3 "[three]" 4 "[four]" 5 "First group" 6 "Second group") position(6)) ///
/// Risk table to print at the bottom:
risktable(0(5)20 , size(small) order(1 "First group" 2 "Second group")) ///
title("Title") ///
t1title("Subtitle") ///
xtitle("Year of Follow-Up") ///
ytitle("Event-Free Survival") ///
/// Here's how you render the HR. Change the first 2 numbers to move it:
text(0 0 "`: display "HR " %4.2f `hrb' " (95% CI " %4.2f `hrlo' "-" %4.2f `hrhi' "; `pvalue')"'", placement(e) size(medsmall)) ///
yla(0(0.2)1)