I recently needed to make a figure for publication and the publisher didn’t like the resolution of the figure that I provided. One option is to increase the number of pixels of the rendered figure (eg increasing the width and height), the other is to create a figure using vectors that can be zoomed in as much as you want without losing quality so the journal can render the figure however they want. When you generate a PNG, JPEG, or TIFF figure, it renders/rasterizes the figure using pixels. Vectors instead embed lines using mathematical formulas, so the rendering of the figure isn’t tied to a specific resolution, and zooming in and out will redraw the lines at the current resolution of the screen. The widely-adopted SVG vector format should be universally accepted as a figure format by publishers, but isn’t for some dumb reason. PDFs and PS/EPS files can also handle vectors and are sometimes accepted by journals but require proprietary software (usually) to render. PS/EPS files are also annoying in that they don’t embed non-standard characters correctly (e.g., beta, gamma, alpha, delta characters).
Stata and R can easily output SVG files. The excellent and free Inkscape app/program can manipulate these to create merged SVG, PS, EPS, or PDFs that can then be provided to a journal. Inkscape is also nice because it will help you get around the problems with non-standard characters not rendering correctly in PS/EPS files since you can export nonstandard characters from SVG files as paths in PS/EPS files. I’m a GIMP proponent for most things but think Inkscape blows GIMP out of the water for manipulating vector images.
Here’s how I manipulated SVG files to make an EPS file to submit to a journal.
Step 1: In Stata or R, export your figure as an SVG file
In Stata, after making your figure, you type –graph export “MYFILENAME.svg”, replace fontface(“YOUR PREFERRED FONT”) — For my figure, I needed to provide Times New Roman, so the fontface was “Times New Roman”. Note that you can’t specify a width for an SVG file. Type –help graph export– to view general export details and details specific for exporting SVG figures.
In R, use the the svglite package that you can read about here.
Step 2: Importing your SVGs in Inkscape
Download and install Inkscape if you haven’t already. To begin, make a new document by clicking File –> New. Change the dimensions under File –> Document Properties. I’m arbitrarily selecting US Letter and changing the format from mm to in, so I have an 8.5×11 in figure. I can change this later.

Now set the background as White, clicking the page button and then typing in 6 f letters in a row (ffffff) if it isn’t already like this. That’s the hexadecimal code for white in RGB.

Now import your figures under file –> import. If you have an R figure, do that one first. After you select your figure, you’ll see this pop up. I set the rendered SVG DPI to 600 and left everything else as default.

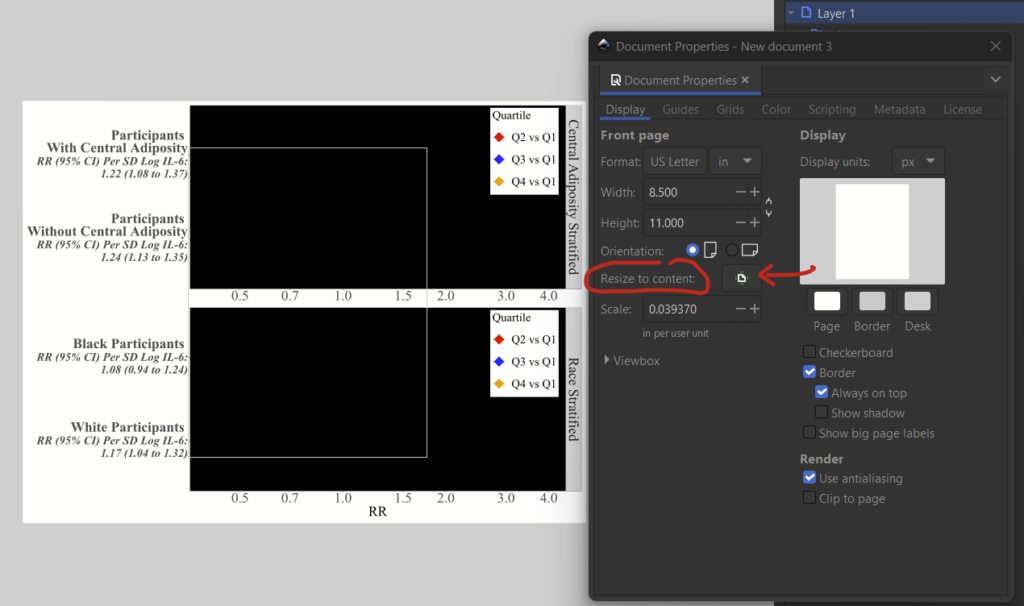
You’ll see that you’ve imported your figure, but it might be a bit bigger than your layer. That’s fine, just go back to file –> document properties and select the “resize to content” button to fix this.

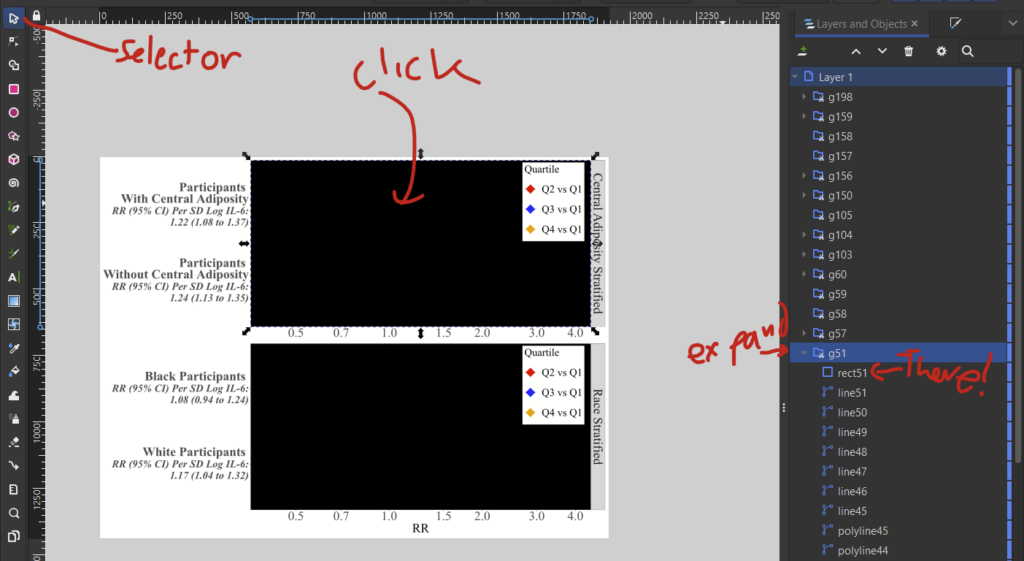
You’ll notice that these R figures have black boxes where the main graphic should be. This is apparently a bug in how R outputs SVG files (I didn’t make these specific files so I’m not sure if it’s also a bug with the svglite package). It’s pretty simple to fix, and is detailed here. It turns out that there’s a layer piece of the figure that R doesn’t specify should be transparent, so Inkspace renders it as black. if you have this problem, follow these steps:
- Click on your figure then ungroup with shift+ctrl+g (or object –> ungroup).
- Now open layers window on the right (if you don’t see it, open it up with layer –> layers and objects).
- With the “selector tool” (the mouse), click the black box and see which layer is selected. Expand that layer and find the “rect” in it.

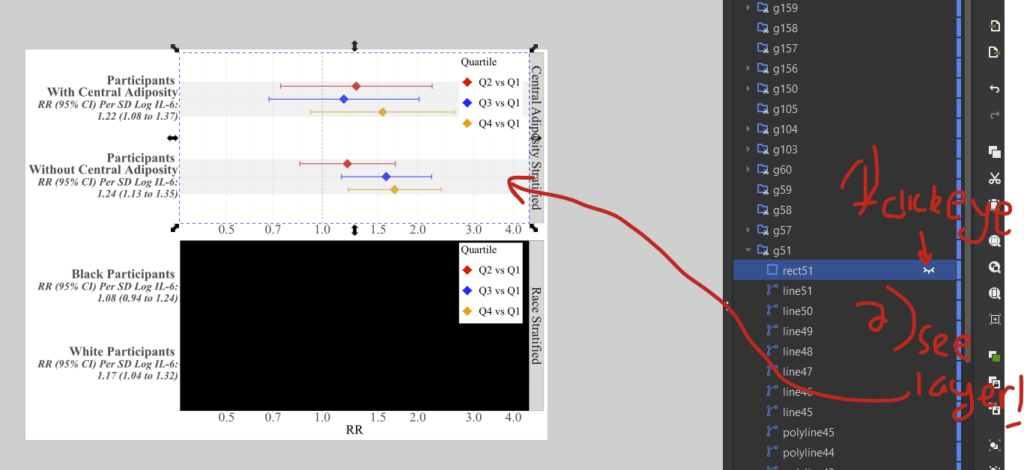
4. If you hover over the “rect” object, you’ll see a little eye icon. This will hide the layer to prove that it’s the offending layer. You’ll be able to see the underlying object.

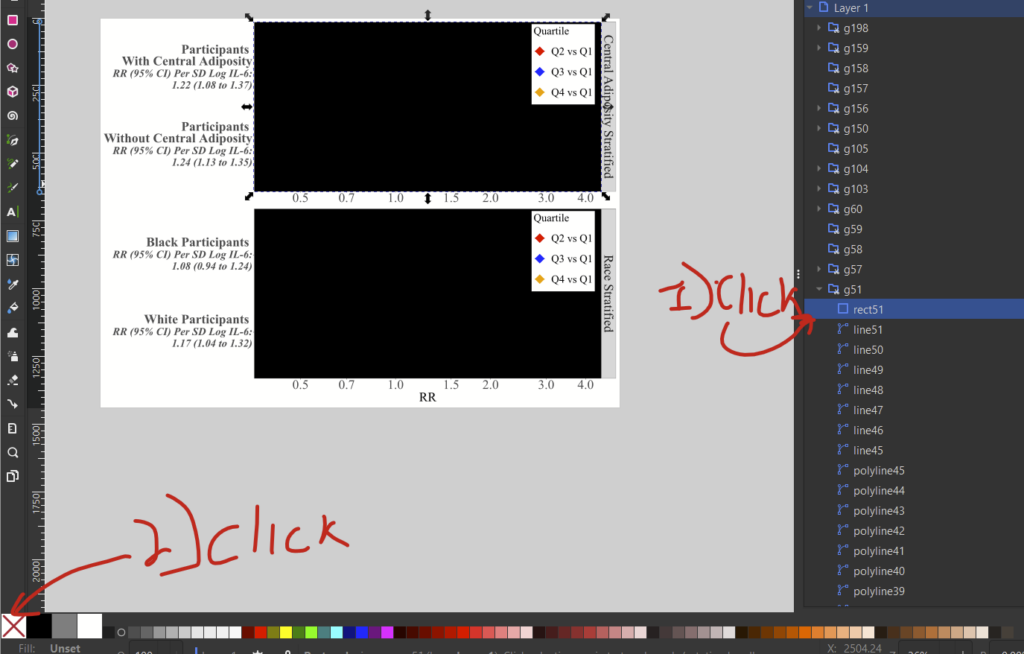
5. Now click it again to unhide it. Then, make sure you have selected that rect layer in the layers window, and click the “no fill” option in the bottom left of the screen (the white box with a red X).

6. (Optional) Drag a box over your figure to select the entire figure and then regroup it (object –> group or ctrl+g).
Now you should be set. I had to repeat the fill color steps for the other box in this figure before regrouping BTW.

Now that I’ve fixed the R bug (hopefully this doesn’t happen to you), I’ve imported my Stata file. It comes in waaay smaller than the R one, which is fine. I’ve placed it below the other file and then (1) click on the new image so I see in/outward facing arrows, then (2) hold down CTRL+shift and select and drag the corner arrow to expand it while preserving the ratio.

I’ve imported another figure below that one. I’ve more-or-less eyeballed the layout and size of these layers, but I can fine-tune the size so they match each other. (1) click on the first figure you want to resize, then (2) click on the little deadbolt figure to lock the proportions — aka so width and height change at the same time, then (3) manually change the width to whatever you want. Then (4) repeat those steps for the other figure, and specify the same width as in step 3. Now you can move around the images so they are placed nicely.

Now you’ll want to expand the document layer so it’s the size of all of the added figures. To do that, (1) select all layers with ctrl-a or edit –> select all, then (2) go to file –> document properties, and (3) click on the “resize to content” button.

Now your layer should perfectly match the size of your figures.
Step 3: Adding overlaying text
I want to add the letters “A” and “B” to this figure since it’s two separate panels. The text tool on the left (capital “A”) allows to add text. So, (1) click the text tool, then (2) choose your font, (3) choose the text size, here 120, (4) select the font color in the bottom left, here black, then (5) click where you want to add your text, and start typing.

You might not get the placement perfect the first time. If you need to move it around, click the selector tool/mouse cursor icon on the top left to move the added text layer around. If you want to edit the text, select the text tool again and re-select your added text.

If your text is outside of the bounds of your document layer, you might want to “resize to content” button one more time (hit ctrl-a then go to file –> document properties, and hit the “resize to content” button).
Step 4: Saving and exporting
Step 4a: Saving as SVG for future editing with Inkscape
Inkscape’s default file format is an SVG, so I recommend saving your file as an SVG to start. Do that with ctrl+s or file –> save.
Step 4b: Saving as EPS, which is the file you’ll want to send to the publisher
The semi-proprietary EPS format is typically accepted by publishers, so you’ll want to generate this one to send off to the journal. This is done under the file –> “save as…” option (or shift+ctrl+s). In the dropdown, select “encapsulated post script (*.eps)”.

On this popup, I unchecked the button next to rasterize filter effects, I selected embed fonts. If you are using nonstandard characters (e.g., alpha, beta, gamma, delta), instead check the “convert text to paths” button. This will change the text so that it’s vectors drawn on the image and not actual font-based text. Set the resolution for rasterization to 600 DPI. Hopefully nothing is actually rasterized since avoiding rasterization was the point of this little exercise.

Note that you’ll now have 2 separate files, one SVG and one EPS (if you did both steps 4a and 4b), so for any additional edits, you’ll want to remember to overwrite your SVG and your EPS files.
Step 4c (optional): Export as PDF so you can share the figure with coauthors
You might want to also save as a PDF since people are familiar with these. I don’t know that I would provide a PDF to a journal, probably just an EPS file. It’s nice to have PDFs to share with coauthors since they are such universally-accepted file formats. Instead of using the “save as…” option, I recommend using the file –> export option (shift+ctrl+e) to export. This will pop up an export window on the bottom right. Set your directory, select file type as PDF, then click on the little settings icon.

On the settings pop-up, I selected “no” for rasterize filter effects. Embedding the fonts might be preferable to converting text to paths since it will retain compatibility with screen reading software. Set the DPI to 600. I also left the default for compensating for rounding. Whatever that means.

Then pop out of that window and click the big export button and you’re done!

