
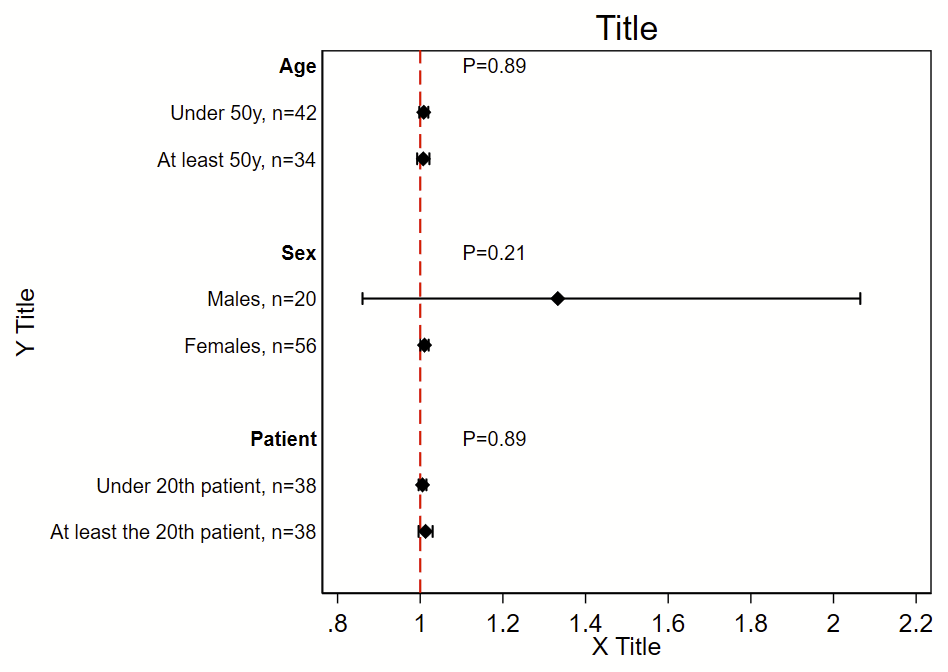
I was the analyst for the myPACE trial (published here in JAMA Cardiology), and needed to put together a subgroup analysis figure. I didn’t find any helpful stock code, so I wrote my own. The code uses the Frames feature that was introduced in Stata 16. It will (a) make a new frame with the required variables but no data, (b) generate a new dichotomous variable from continuous variables, (c) generate labels, (d) grab the Ns, point estimates, and 95% CI from a logistic regression, (e) grab the P-value for interaction for the primary exposure dependent variable*, (f) write the point estimate/95% CI/P-value for interaction to the new frame, then (g) switch to the new frame and make this figure. This script uses local macros so needs to be run all at once in a do file, not line by line.
This uses a stock Stata dataset called “catheter”. The outcome of interest/dependent variable is “infect”, the primary exposure/independent variable of interest is “time”, and the subgroups are age, sex, and patient number. This uses logistic regression, but you can easily swap this model out for any other model.
*You can get more complex code to format the P-values here.
Here’s the code!
frame reset // drop all existing frames and data
webuse catheter, clear // load analytical dataset
version 16 // need Stata version 16 or newer
*
* Make an empty frame with the variables we'll add later row by row
* The variables "rowname" and "pvalue" will be strings so when
* you add to these variables with the --frame post-- command,
* you need to use quotes.
frame create subgroup str30 rowname n beta low95 high95 str30 pval
*
*** Age
* Need to generate a dichotomous age variable
* You don't need to do this if the variable is already dichotomous,
* ordinal, or nominal
generate agesplit = (age>=50) if !missing(age) // below 50 is 0, 50 and above is 1
*
* Now generate a label for the overall grouping
local label_group "{bf:Age}"
*
* Group 0, below age 50
* Generate label for this subgroup
local label_subgroup_0 "Under 50y"
* Now run the model for this subgroup
logistic infect time if agesplit==0
* Now save the N, beta, and 95% CI as local macros.
* There's lots you can save after a regression, type --return list--,
* --ereturn list--, and --matrix list r(table)-- to see what's there
local n_0 = e(N)
local beta_0 = r(table)[1,1]
local low95_0 = r(table)[5,1]
local high95_0 = r(table)[6,1]
* print above local macros to prove you collected them correctly:
di "For `label_subgroup_0', n=" `n_0' ", beta (95% CI)=" %4.2f `beta_0' " (" %4.2f `low95_0' " to " %4.2f `high95_0' ")"
*
* Group 1, at least 50 years old
local label_subgroup_1 "At least 50y"
logistic infect time if agesplit==1
local n_1 = e(N)
local beta_1 = r(table)[1,1]
local low95_1 = r(table)[5,1]
local high95_1 = r(table)[6,1]
di "For `label_group', subgroup `label_subgroup_1', n=" `n_1' ", beta (95% CI)=" %4.2f `beta_1' " (" %4.2f `low95_1' " to " %4.2f `high95_1' ")"
*
* Now run the model with an interaction term between the primary exposure
* and the subgroup.
logistic infect c.time##i.agesplit
* Grab the p-value as a local macro saved as pval
local pval = r(table)[4,5]
* Print that local macro to see that you've grabbed it correctly
di "P-int = " %4.3f `pval'
* Format that P-value and save that as a new local macro called pvalue
local pvalue "P=`: display %3.2f `pval''"
di "`pvalue'"
*
* Now write your local macros to the the "subgroup" frame
* Each "frame post" command will add 1 additional row to the frame.
* We will graph these line by line.
* First line with overall group name a P-value for interaction:
frame post subgroup ("`label_group'") (.)  (.) (.) (.) ("`pvalue'")
* Now each subgroup by itself:
frame post subgroup ("`label_subgroup_0'") (`n_0')  (`beta_0') (`low95_0') (`high95_0') ("")
frame post subgroup ("`label_subgroup_1'") (`n_1')  (`beta_1') (`low95_1') (`high95_1') ("")
* Optional blank line:
frame post subgroup ("") (.) (.) (.) (.) ("")
*
*** Female sex
* This is already dichotomous, so don't need to create a new variable
* like we did for age.
local label_group "{bf:Sex}"
*group 0, males
local label_subgroup_0 "Males"
logistic infect time if female==0
local n_0 = e(N)
local beta_0 = r(table)[1,1]
local low95_0 = r(table)[5,1]
local high95_0 = r(table)[6,1]
*group 1, females
local label_subgroup_1 "Females"
logistic infect time if female==1
local n_1 = e(N) // N
local beta_1 = r(table)[1,1]
local low95_1 = r(table)[5,1]
local high95_1 = r(table)[6,1]
*interaction P-value
logistic infect c.time##i.female
local pval = r(table)[4,5]
local pvalue "P=`: display %3.2f `pval''"
*write to subgroup frame
frame post subgroup ("`label_group'") (.)  (.) (.) (.) ("`pvalue'")
frame post subgroup ("`label_subgroup_0'") (`n_0')  (`beta_0') (`low95_0') (`high95_0') ("")
frame post subgroup ("`label_subgroup_1'") (`n_1')  (`beta_1') (`low95_1') (`high95_1') ("")
frame post subgroup ("") (.) (.) (.) (.) ("")
*
*** patient
* need to generate a patient dichotomous variable
generate patientsplit = (patient>=20) if !missing(patient) // below 20 is 0, 20 and above is 1
local label_group "{bf:Patient}"
*group 0, below 20
local label_subgroup_0 "Under 20th patient"
logistic infect time if patientsplit==0
local n_0 = e(N)
local beta_0 = r(table)[1,1]
local low95_0 = r(table)[5,1]
local high95_0 = r(table)[6,1]
*group 1, 20 and above
local label_subgroup_1 "At least the 20th patient"
logistic infect time if patientsplit==1
local n_1 = e(N)
local beta_1 = r(table)[1,1]
local low95_1 = r(table)[5,1]
local high95_1 = r(table)[6,1]
*interaction P-value
logistic infect c.time##i.agesplit
local pval = r(table)[4,5]
local pvalue "P=`: display %3.2f `pval''"
*write to subgroup frame
frame post subgroup ("`label_group'") (.)  (.) (.) (.) ("`pvalue'")
frame post subgroup ("`label_subgroup_0'") (`n_0')  (`beta_0') (`low95_0') (`high95_0') ("")
frame post subgroup ("`label_subgroup_1'") (`n_1')  (`beta_1') (`low95_1') (`high95_1') ("")
frame post subgroup ("") (.) (.) (.) (.) ("")
*
*** Now make the figure. You'll have to modify this so the number of rows
*   in your subgroup frame matches the labels and whatnot
set scheme s1mono // I like this scheme
* Change frame to the subgroup frame
cwf subgroup
* Generate a row number by the current order of the data in this frame
gen row=_n
* Here's the code to make the figure
twoway ///
(scatter row beta, msymbol(d) mcolor(black) msize(medium)) ///
(rcap low95 high95 row, horizontal lcolor(black) lwidth(medlarge)) ///
, ///
legend(off) ///
xline(1, lcolor(red) lpattern(dash) lwidth(medium)) ///
title("Title") ///
yti("Y Title") ///
xti("X Title") ///
yscale(reverse) ///
yla( ///
1 "`=rowname[1]'" ///
2 "`=rowname[2]', n=`=n[2]'" ///
3 "`=rowname[3]', n=`=n[3]'" ///
4 " " /// blank since it's a blank row
5 "`=rowname[5]'" ///
6 "`=rowname[6]', n=`=n[6]'" ///
7 "`=rowname[7]', n=`=n[7]'" ///
8 " " /// blank since it's a blank row
9 "`=rowname[9]'" ///
10 "`=rowname[10]', n=`=n[10]'" ///
11 "`=rowname[11]', n=`=n[11]'" ///
12 " " /// blank since it's a blank row
, angle(0) labsize(small) noticks) ///
xla(0.8(.2)2.2) ///
text(1 1.1 "`=pval[1]'", placement(e) size(small)) /// these are the p-value labels
text(5 1.1 "`=pval[5]'", placement(e) size(small)) ///
text(9 1.1 "`=pval[9]'", placement(e) size(small))
*
* Now export your figure as a PNG file
graph export "myfigure.png", replace width(1000)