
Dot and confidence interval figures in Stata
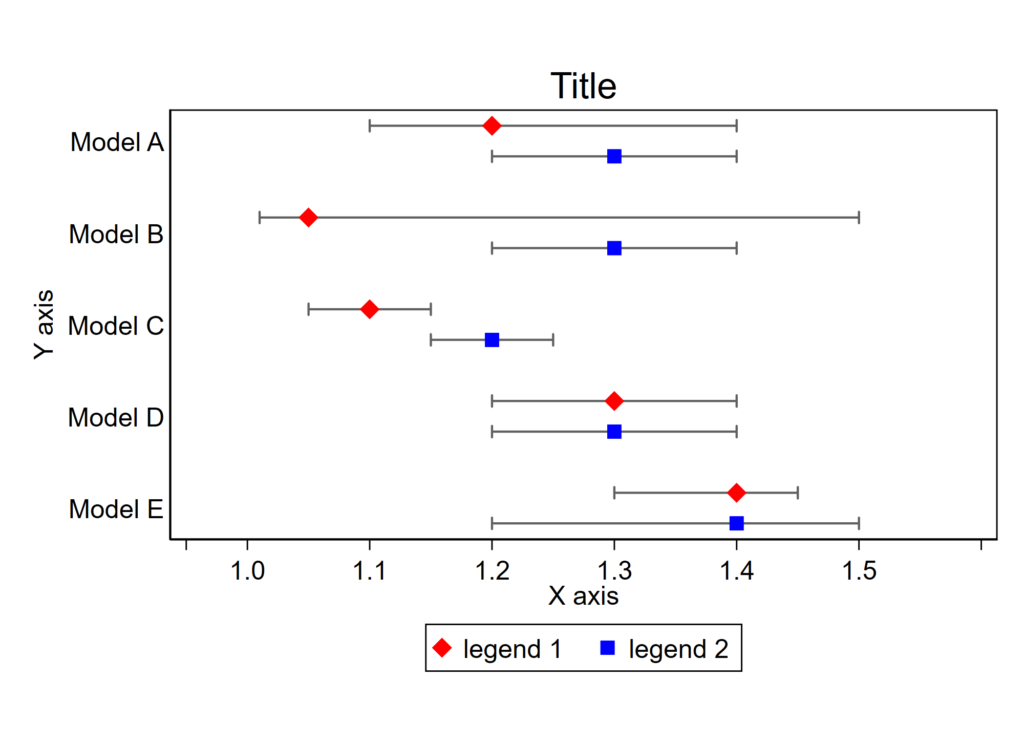
Stata has a pretty handy -twoway scatter- code that can be combined with -twoway rcap- to make the figure below. Example code at the bottom.
Horizontal version
Vertical version

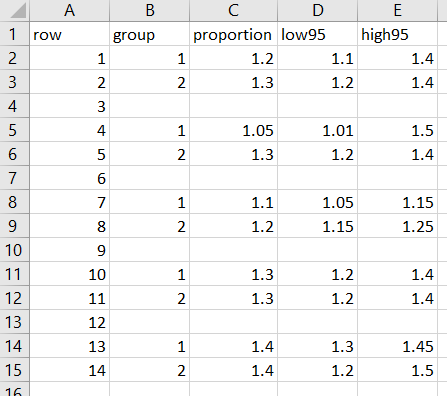
First step, make an Excel file or input directly in a do file
You might find it a bit easier to input data from an excel file than straight in a do file. Here’s an example of an excel file called “dot and 95 percent ci data.xlsx” saved in the same folder as my .do file. This figure will display row 1 at the top and row 14 at the bottom. The gaps in between the lines are the absent rows 3,6, 9, and 12. Group tells Stata if you want a red diamond or blue square. Proportion is the point estimate and low95 and high95 are the surrounding 95% confidence intervals.
Note that the data here are made up and are not related to any actual ongoing clinical investigation.
Alternatively, you can use Stata’s –input– functionality to input data from the top of your do file. I’ve been doing this step more often recently. Things to remember: (1) variables in Stata cannot start with a number, hence ‘low95′ and not ’95low’ above, (2) remember to use –end– at the end of your input command, (3) if you are inputting a string variable, specify that the following variable is a string (e.g., “strL varname”) in your input loop, and (4) remember to use blanks (dots or “” for strings) for missing variables. Here’s what the above would look like using an –input– command in the do file, right above the following code.
clear all // clear all data in memory

input ///
group proportion low95 high95
1 1.2 1.1 1.4
2 1.3 1.2 1.4
. . . .
1 1.05 1.01 1.5
2 1.3 1.2 1.4
. . . .
1 1.1 1.05 1.15
2 1.2 1.14 1.25
. . . .
1 1.3 1.2 1.4
2 1.3 1.2 1.4
. . . .
1 1.4 1.3 1.45
2 1.4 1.2 1.5
end

// this makes a variable that's 1 through n for each row by group, called "row"
gen row = _n
Next step, make a .do file
In the same folder as the Excel file, copy/paste/save the code below as a .do file. Close Excel and close Stata then find the .do file from Windows Explorer and double click it. Doing this will force Stata to set the working directory as the folder containing the .do file (and the Excel file).
If the code won’t work, you probably have Excel open. Close it and try again.
That’s it! Code for both versions of the figure follows.
********************************************************************************
******************************IMPORT DATA HERE**********************************
********************************************************************************
// if importing from an excel file, do that here:
clear all // clear all data in memory
import excel "dot and 95 percent ci data.xlsx", firstrow clear
destring, replace

// if using Stata's --input-- command, plop that here (see example code above)

********************************************************************************
******************************CODE STARTS HERE**********************************
********************************************************************************
set scheme s1mono // black and white

twoway ///
(rcap low95 high95 row, horizontal) /// code for 95% CI
(scatter row proportion if group ==1, mcolor(red)) /// dot for group 1
(scatter row proportion if group ==2, mcolor(blue)) /// dot for group 2
, ///
legend(row(1) order(2 "legend 1" 3 "legend 2") pos(6)) /// legend at 6 o'clock position
ylabel(1.5 "Model A" 4.5 "Model B" 7.5 "Model C" 10.5 "Model D" 13.5 "Model E", angle(0) noticks) ///
/// note that the labels are 1.5, 4.5, etc so they are between rows 1&2, 4&5, etc.
/// also note that there is a space in between different rows by leaving out rows 3, 6, 9, and 12
xlabel(.95 " " 1 "1.0" 1.1 "1.1" 1.2 "1.2" 1.3 "1.3" 1.4 "1.4" 1.5 "1.5" 1.6 " ", angle(0)) /// no 1.6 label
title("Title") ///
xtitle("X axis") ///
ytitle("Y axis") ///
yscale(reverse) /// y axis is flipped
xline(1.0, lpattern(dash) lcolor(gs8)) ///
/// aspect (next line) is how tall or wide the figure is
aspect(.5)

graph export "dot and 95 percent ci figure horiz.png", replace width(2000)
//graph export "dot and 95 percent ci figure horiz.tif", replace width(2000)


********************************************************************************
******************************CODE STARTS HERE**********************************
********************************************************************************
set scheme s1mono // black and white

twoway ///
(rcap low95 high95 row, vert) /// code for 95% CI
(scatter proportion row if group ==1, mcolor(red)) /// dot for group 1
(scatter proportion row if group ==2, mcolor(blue)) /// dot for group 2
, ///
legend(row(1) order(2 "legend 1" 3 "legend 2") pos(6)) /// legend at 6 o’clock position
xlabel(1.5 "Model A" 4.5 "Model B" 7.5 "Model C" 10.5 "Model D" 13.5 "Model E", angle(0) noticks) ///
/// note that the labels are 1.5, 4.5, etc so they are between rows 1&2, 4&5, etc.
/// also note that there is a space in between different rows by leaving out rows 3, 6, 9, and 12
ylabel(0.9 "0.9" 1 "1.0" 1.1 "1.1" 1.2 "1.2" 1.3 "1.3" 1.4 "1.4" 1.5 "1.5" , angle(0)) /// no 1.6 label
title("Title") ///
xtitle("X axis") ///
ytitle("Y axis") ///
yline(1.0, lpattern(dash) lcolor(gs8)) ///
/// aspect (next line) is how tall or wide the figure is
aspect(.5)

graph export "dot and 95 percent ci figure vert.png", replace width(2000)
//graph export "dot and 95 percent ci figure vert.tif", replace width(2000)