Business Benchmarks for a Start-Up Small Vegetable Farm

Last week I had the opportunity to sit with 9 farm managers and business advisers to analyze 3 years of farm financial data for 25 farms. This meeting was closure on a  three year research project coordinated by The Carrot Project and funded by Northeast SARE. The project set out to deliver financial education, measure financial performance and assist in planning for micro loans (under $25,000) with farm managers in New England.

How much money can a small vegetable farm owner expect to make? After looking at three specific sets of finances and combining that with the numerous farm financial statements I read every year for UVM Extension Farm Viability, I have observed a few key trends for small vegetable farms:

  1. Farm start up is driven by initial owner visions, resources at hand and easily accessible markets.
  2. Early market plans of direct sales (CSA, farmers market) mixed with direct wholesale (stores/restaurants) typically gets the business to about $35,000 – $50,000 in gross sales somewhat “easily”. At that point, the market mix is maxed out and it becomes difficult to expand. The business now needs a phase 2 market strategy.
  3. Owner operated produce farms can hit $30-40,000 in annual sales with one full time equivalent/FTE (the owner) working seasonally. During this phase, the owner may be able to pay themselves up to 20%-30% of gross sales from cash flow if costs are managed well… that equals a paycheck of maybe $10,000 not including equity generation as assets are acquired and paid for.
  4. To grow past $40,000 in sales, hired labor is required. This paid labor will require cash that typically leaves an owner unable to pay themselves from the business. I advise managers to find ways to leap-frog or grow through the $40,000-$80,000 scale as fast a possible. It’s a tough scale to operate at.
  5. As the produce business hits the $80,000 – $125,000 scale, many of the blips of start up have passed. The farm is in Phase 2 of marketing, usually including a reduced amount of direct sales and a specialization of few key crops for wholesale. A small but manageable labor force (and formula) is in place.
  6. Here are some benchmarks at this scale: try to keep hired labor at 30-45% of gross sales, capital expenses or debt service will range from 10-20% of gross sales (largely depending on how the real estate is being paid for) and owner draws might be about 25% of gross sales.


Changes to VT Current Use Tax Program

Changes have been made to the Vermont Use Value Appraisal Program (Current Use) that guides the taxation of land and buildings used for agriculture, forestry and conservation.

Click this link for a resource sheet that explains the new changes: Changes in VT Current Use Tax Program _July 2015

Key changes include:

  • A new calculation for the Land Use Change Tax (LUCT) (beginning Oct. 2, 2015)
  • A temporary “easy-out” period in which landowners can remove a parcel, or portion of a parcel, without paying the full LUCT liability (between July 1 and Oct. 1, 2015).
  • A new annual requirement for owners of agricultural lands and buildings to certify in writing on or before September 1 of every year that all enrolled agricultural land and buildings meet the requirements for enrollment at the time of the certification (form will be available in August).
  • Authority given to Agency of Agriculture, Food and Markets to direct the Vermont Department of Taxes to remove agricultural land and farm buildings from the Current Use Program when the land or buildings are used by a person who has violated water quality requirements (beginning July 1, 2015).

The Winery: Keys to Financial Success

Image

uvm hort whites 1

In June I attended the National Farm and Ranch Business Management Educators annual conference in Rochester NY. Steve Richards, manager at Casa Larga Vineyards and Winery (Fairport, NY), shared his expertise on managing a winery. Steve also worked for many years at Farm Credit East and the Winery Benchmarks Program: https://www.farmcrediteast.com/winerybenchmarks

New York State Wine Overview

• Influence of international trade: when Australia grape/juice prices go down, wineries will increase usage of this supply up to the allowable thresholds under current regulations
• 60% of wine volume produced is non-varietal sweeter wines
• Riesling is the top NYS varietal, about 10-15% of overall wine volume produced
• A good way to forecast wholesale wine sales is to research the general restaurant sales forecast for the upcoming periods.

Keys to Financial Success:

Inventory Turnover: a typical winery will to have 1.5- 3 years max of annual sales in inventory. Larger inventory is less favorable and wineries must work to increase the number of inventory turns per year to over 1. Successful wineries move inventory faster and bottle final product as close to sales date as possible (accounting for any bottling/conditioning factors influencing final quality). Aging inventories over 3 years old is less desirable.
Labor Efficiency: Wineries track cases per worker and this is a key focus of scaling the business. The biggest cost factor as a winery grows is the overhead costs of marketing and regulatory compliance. There are labor efficiency sweet spots at different scales

  • 500-2,500 cases is a good place to be. Labor efficiency ranges from 6k-10k  cases per full time worker.
  • At ~5,000 cases the retail only establishment has maxxed out on sales. The winery begins to wholesale product. This creates an increased administrative burden to serve these new markets.
  • 5,000 – 10,000 cases tends to be poor scale for labor efficiency, possibly down to 4k cases per worker
  • At around 15,000 cases the labor efficiency curve begins to get better.
    Labor efficiency peaks at the scale of ~35,000 cases per year, with the labor benchmark approaching 10,000 cases per full time worker.

What Farm Business Advisors are Talking About

This week the UVM Extension Farm Viability program and statewide VT Farm and Forest Viability Program partners got together to discuss current topics impacting farms.

Dennis Kauppila lead a discussion on farm business partnerships. We reviewed an older but still relevant resource guide that leads farm business owners that are setting up a partnership. Click here to download  Michigan State University: Farm Partnership Agreement Worksheet

Food safety is on our minds with the expectation of new federal  produce safety regulations this fall and the existing GAP’s/buyer-based verification programs. Ginger Nickerson explained the different post harvest packing and storage investments that produce growers are making  that can improve product quality in addition to meeting safety requirements. Click this link for a  fact sheet on building open packsheds. If you are thinking bigger, then click this link on renovating old barns .

A business planning meeting would not be complete without a discussion on risk management and crop insurance programs. Jake Jacobs, UVM Extension Crop Insurance Educator, provided an update on whole farm revenue insurance, Margin Protection for Dairy and the NAP program that could be used for maple producers. Click this link for a USDA Risk Management Agency (RMA) 2014 Farm Bill Crop Insurance Modifications


December 5th Deadline, Dairy Margin Protection Program

The deadline for enrollment in the Margin Protection Program for Dairy has been extended to Friday December 5th. MPP is a  revenue risk management tool for dairy producers when the difference between the price of milk and price of feed falls below coverage levels that farmers themselves choose. Dairy producers should contact their local USDA Farm Service Agency office to get information on enrollment this week. This weeks deadline marks the last chance dairy farms will have access to this program until 2016.

Information about the MPP-Dairy is available from USDA Farm Service Agency at this website: USDA FSA , MPP DAIRY

An online decision tool is available for farmers to use at this website: MPP DECISION TOOLThe tool allows a farmer to see the financial impact of how MPP enrollment would impact their business at different selected coverage levels. Instructions on how to use the tool are available on the website.

Farm Business Specialist Dennis Kauppila (UVM Extension) has created a simple worksheet that can be filled out while using the online decision tool. The sheet allows you to see how this program would impact your farm had the program been running in 2009 and 2012. Download the worksheet here: MPP-Dairy 3 year tables-1

Here is a list of Vermont FSA offices: VERMONT FSA COUNTY MAP (click your county on the map to get contact information)

Crop Storage Workshops and Profitability

UVM Extension Ag Engineer Chris Callahan will be offering crop storage workshops this fall. Click this link for details on events in October: Crop Storage Workshops

Inventory turnover and asset turnover are key factors to consider when you make the investment in crop storage. “Turnover” ratios provide efficiency measures that reveal how much bang you get for your buck. Here are two possible ways to improve these ratios: a) select high “value per volume” products for long term storage and b) move more product through the storage unit over the course of the year (more turns).

Quick example 1: Farmer Mark grows $25,000 of potato and has them all in storage on January 1. He sells them all winter and hits gross sales of $22,000 (there are always losses!). The cooler sits empty until next season. Thats 1 turn on the inventory, not so great. How could he improve? He could  grow a  $15,000 beet crop that fills the storage unit from July – October before the potatoes go into storage. Now he’s moving more product and increasing efficiencies by getting more product sales from the same storage investment.

Quick Example 2: Farmer Beth fills a walk in cooler with a variety of root crops in October, turnips, carrots, beets and even some cabbage. She wants to increase her profits next year. She wants to figure out which crop is worth the most in relation to the volume it requires. To keep it simple, she fills a .5 bushel box with each crop and multiplies weight x sell price. She could drop the lowest value per volume crop and grow more of the higher value per volume crop. She better factor in her marketing plan the selling costs though, high value crops may cost more to market…better keep the calculator out.

Click this link for October Crop Storage Workshops


Meetings to Explain Dairy Margin Protection Program

What is your plan to handle dairy milk price volatility and feed cost shifts over the next 3 years? Informational meetings are planned for October 13-17  throughout Vermont to explain the program to dairy farmers and business specialists.

Click this link for a list of sessions and locations: October Schedule: Dairy Margin Protection Program Meetings

Navigating Federal Laws on Farm Labor

This morning agency representatives and professionals hosted a session at the Vermont State House devoted to understanding labor laws for agricultural employers. Agricultural employers cannot expect to be experts on these topics but they must be aware of the important issues and understand when it is essential to contact specialists to assess specific situations.

Today’s topics included key provisions of the Federal Labor Standards Act (FLSA) and an introduction to potential exemptions for agricultural businesses. It was explained that the Wage and Hour determinations are based on a week of work. So if you have an agricultural employee working 38 hours in the field picking strawberries and that same worker spends just 3 hours in the farm retail store running a register…that entire week could be considered non-agricultural and subject to FLSA (wages and overtime were the most common discussion topics). Notice I said “could be” as it could vary based on if the store sells strawberry jam or if other products from other farms are resold in the store. There are a variety of agricultural exemptions that should be understood thoroughly to ensure a business remains in compliance with the law.

And for the details… here are several of the resources that were referenced.  US Department of Labor Fact Sheets: #71 Interships, #13 Relationship Determinations, #26 H-2-A, #12 AG Employees, #14 Coverage, #50 Trasportation, #49 Migrant and Seasonals, #40/43 Youth.

To access these sheets, click this link to the DOL Wage and Hour Fact Sheets online.

The US Department of Labor has a district office in New Hampshire that can be contacted at information listed here: http://www.dol.gov/whd/america2.htm#Vermont

IRS Publication 225: Farmer’s Tax Guide

It is the time of year for many questions that lead back to tax preparation.

Here is a link to the current IRS Farmer’s Tax Guide

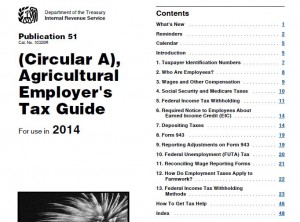
We are also seeing more scrutiny being placed on the distinction between “agricultural” employees compared to “retail” or “non-ag” employees. Owners of businesses that diversify,  take on retail operations or manage  non-traditional farm activities will want to get familiar with the legal thresholds on employee classification. Read more in the IRS Publication 51: Agricultural Employers Tax Guide. Look at sections relating to Form 943 starting on page 18.

IRS pub 51 ag employers


2014 Planned Grazing Charts Available: Plan for profitable grazing!

I see green ($) when I see well managed pastures. Improved pasture management can lead to increased weight grain per day for meat production and improved income over feed costs in dairy operations.

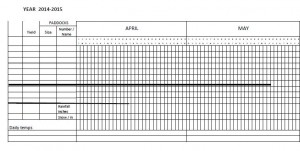
Troy Bishopp at Central New York RC&D has just posted new 2014-15 Planned Grazing Charts. Go this link to download a chart for yourself:

http://cnyrcd.squarespace.com/planned-grazing-participants/

Charts are available for 10,20 and up to 40 paddock systems

22 graze plan close up