3 Ways to Get Started Creating Accessible Presentations

The following content was submitted to the Teaching Tips Consortium of the POD Network by
Kevin S. Wilson, Instructional Design Consultant
Center for Teaching and Learning, Boise State University

Use the templates packaged with the slideshow software.
Templates offer a number of benefits. They establish a logical, hierarchical organizational structure, conveyed visually through titles, headings, and subheadings. Templates also use typefaces pre-selected for legibility. The layout of text in a template—along with sufficient white space—helps people with dyslexia or low vision to navigate the slide. The layout also provides visual signals about the content, including priority, importance, specificity, and subordination.

Make text and visuals big enough to be legible from the back of the room. Whenever possible, test drive your presentation in the room in which you will be presenting. Ideally, have a colleague view your slides from the back of the room to see if all the content is discernible. Limit the amount of text on a single slide; large amounts of text will appear crowded and small. Keep bulleted or enumerated lists to three to five items. Use a common sans-serif font (such as Arial, Calibri, or Helvetica.)

Use color carefully.
Use color with care—which often means NOT using color. For instance, you should avoid using color alone to emphasize text or to identify information as important. People with color blindness may not be able to see the color, so they will miss whatever emphasis or importance you’ve attached to the text. Also, avoid combining colors with insufficient contrast (e.g., yellow text on a white background). Using the templates in your slideshow software is one way to ensure sufficient color contrast, because each template has been designed by professionals for maximum clarity

Want to learn more?
For tips on making PowerPoint presentations accessible to people with low vision or people using screen readers, see Make Your PowerPoint Presentations Accessible. Additionally, in How to Make Presentations Accessible to All, the Web Accessibility Initiative provides advice on planning, designing, and delivering accessible presentations.

Posted in Technology | Comments Off on 3 Ways to Get Started Creating Accessible Presentations

3 Ways to Get Starting Creating Accessible Images

The following content was submitted to the Teaching Tips Consortium of the POD Network by
Kevin S. Wilson, Instructional Design Consultant
Center for Teaching and Learning, Boise State University

Use ALT tags to describe images.
An ALT tag is a descriptive label attached to an image. For people who are blind or who have low vision, screen-reading software reads aloud the description contained in the ALT tag. Microsoft Office, Google Docs, WordPress, and most other content-creation tools offer simple ways to add ALT tags to images. For a variety of reasons (mostly technical), ALT tags should contain fewer than 125 characters. If you cannot adequately describe the image in an ALT tag, also provide a long description by using the LONGDESC tag.

Reduce or eliminate text in images.
Screen readers can’t read text in an image or interpret complex visuals (e.g., equations, graphs, maps). Avoid using text in images if the text conveys meaningful content (as opposed to being strictly decorative). Additionally, use large, high-quality images to ensure accessibility for students with low vision.*

Provide a narrative version of complex visuals.
Complex visuals containing alphanumeric values are often essential to instruction. When you include a chart, equation, or similarly complex visual, craft an instructionally relevant description or explanation of the image. For example, on exams, you can carefully describe an image while still providing students the opportunity to interpret or draw conclusions from the image. In assigned readings, providing descriptions of complex visuals can help students understand them.

Interested in learning more?
Find more tips on image accessibility at WebAIM (Web Accessibility in Mind), and view the video How to Make Graphs, Charts and Maps Accessible.

*Editor’s note: Large, high-quality images should be used thoughtfully, because they are much slower to load, especially on internet connections with lower bandwidth. If your image is detailed and is intended to be analyzed, then a large, high-quality version will likely be best. If the image is simpler, then use a free photo editor (such as befunky) to resize the image; try ~400 px for the width or height and keep the aspect ratio locked to automatically adjust the corresponding dimension.

Posted in Technology | Comments Off on 3 Ways to Get Starting Creating Accessible Images

Save Time and Headache: Bb Date Management Tool

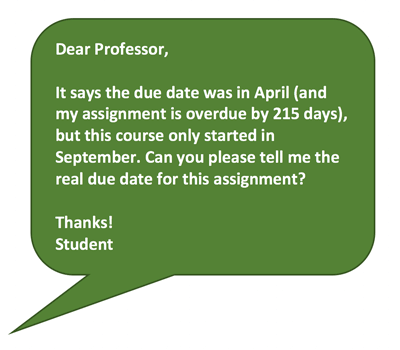
While editing a document to change dates from one semester to the next (syllabus editing, anyone?) might be the epitome of Fake Student Messageadministrivia, Blackboard, fortunately, has a handy Date Management tool to automatically make many such updates.

First, bring your old content into your new Blackboard course shell (using the Course Copy or Import tool).

Second, use the Date Management tool to adjust all Bb dates (such as due dates and availability dates) to match the new semester for your copied or imported content. In most cases, choose the “Use Course Start Date” option, and set the first class session as the new course start date. All due dates will then calculate and update accordingly.

This short video tutorial provides clear step-by-step instructions:

Posted in Blackboard Tips, CTL Home Page | Comments Off on Save Time and Headache: Bb Date Management Tool

Putting Your Course(s) to Bed

You put a lot of work into your Blackboard course space. As we move through each semester there are tasks you can do to protect that work. This checklist can help you wrap up the semester and make the transition to a new semester run more smoothly.

Links throughout this post take you to specific “How To” pages at the CTL’s Blackboard Help site at: http://www.uvm.edu/ctl/blackboard

At the end of the semester

  • Download the final Backup of your Grade Center to store for your records.
  • Create, download, and store an Archive of your course. An Archive is a compressed file that contains all the information you have built in your course as well as your student grades. It can be used to build a new course and it should be saved as your backup of your grade center and your course materials.
  • If you have no need to have students continue to access your courses, make them unavailable. This helps to keep their course lists from being cluttered with old courses.
Posted in Blackboard Tips, CTL Home Page | Comments Off on Putting Your Course(s) to Bed

Resources for Getting started With Blackboard

For instructors who are new to Blackboard or who just want a refresher, there are a number of ways to learn.

  1. See the recently-launched CTL resource, “Teaching with Blackboard.”
  2. For general one-on-one help setting up your course and getting to know Bb, you may wish to visit our Open Hours for support.
  3. Keep an eye on our events calendar, as we periodically offer Blackboard intro courses, which cover such topics as:
    • Introduction to Bb (the what’s and the where’s)
    • Grade Center set up
    • Communication tools
    • Grading with rubrics
    • Delivering tests and assessments
  4. There are many help files and documentation articles available on our site, as well as on Lynda.com, (to which UVM subscribes – see how to log in and access Lynda materials).
  5. For a deeper dive into teaching fully online, the CTL offers a four-week, cohort-based, 100% online course known as “Teaching Effectively Online (TEO).” Find out more about this program, including application details and upcoming session start dates, on the TEO webpage.
Posted in Blackboard Tips, CTL Home Page, Technology | Comments Off on Resources for Getting started With Blackboard

iClicker Reminders for New Semester

Here are a few reminders as you get your course up and running to use iclickers:

  1. Only install iClicker software from our website CTL. It has special settings for UVM and Blackboard. Link to iClicker page on CTL website
  2. Check for updates to iClicker software before syncing your roster with your course in Blackboard.
  3. Make sure your course is available in Blackboard before trying to sync the first time.
  4. Review this post for iClicker Gotchas Link to iClicker Gotchas post.
  5. Have your students register their iClickers (and REEF) through Blackboard (after logging in), but before clicking on the course.
  6.  Back up your classes folder in iClicker often. Like every week or so. You can write over the old folder if it is for the same course.

Want to learn more about iClickers at UVM? Look at our iClicker Page

Also, if you want to do a test run with your class or try iClickers for a few class sessions without committing- make an appointment to come and talk to us about getting set-up and borrowing iClickers. We are also available during to talk more about iClickers at the Doctor Is In, our walk-in help program: www.uvm.edu/ctl/doctor.

Posted in CTL Home Page, Resources, Technology | Tagged , , , , | Comments Off on iClicker Reminders for New Semester

Micropublishers

Creating web-based documents, presentations, infographics, or flyers does not require learning how to create an entire web site. Creating a website involves the creation of multiple pages, deciding how to organize that material so that your viewers navigate through it, and wrapping that all in a cohesive design. Even the simplest web sites can demand more time than can be spent on a single-semester project. While there are tools like Wix.com and Weebly.com that make it possible to create and publish entire web sites without learning complex coding or design, it is still a daunting task.

However, creating and publishing materials online is a current norm. We expect resources will be delivered online–for example, presentations that include video, infographics or posters that are not limited to pre-determined paper sizes, a syllabus or course description flyer that is aesthetically appealing, and concisely written essays or reports with links, illustrations, or embedded video.

Students would like to know how to do this, and they often find creating these types of projects engaging and rewarding.

What to do? Micropublishing apps provide design templates and server space so that you or your students can create “one-pagers”–well-designed web pages into which they can pour their text, images, videos, and links–without having to learn complex web editing or coding. For instance, you may want to create a syllabus or course description page that is image-rich and includes videos. Your students could create illustrated essays with embedded video. Or you or your students could create concise infographics or flyers. Each of these would be contained on a single web page. A link would be generated that could be shared by email or placed in a document.

The following examples include two apps designed to create long-form web pages with room for lots of text and images: Populr.me and Strikingly, and two designed for creating short-form pages for things like infographics, flyers, or brochures: Canva and Piktochart. Each of the apps offer free space to create and store your work, with the option to pay for a Pro version that includes more features.

I’ve designated them as long-form and short-form but even that is somewhat arbitrary. Each keeps adding more features and expanding the possibilities. For example, while Strikingly began as a one-pager it has now expanded to include a blog.

Populr.me

For when you want a traditional web page, don’t want the hassle of trying to figure out how to make text boxes or columns, but would like some color and design elements.
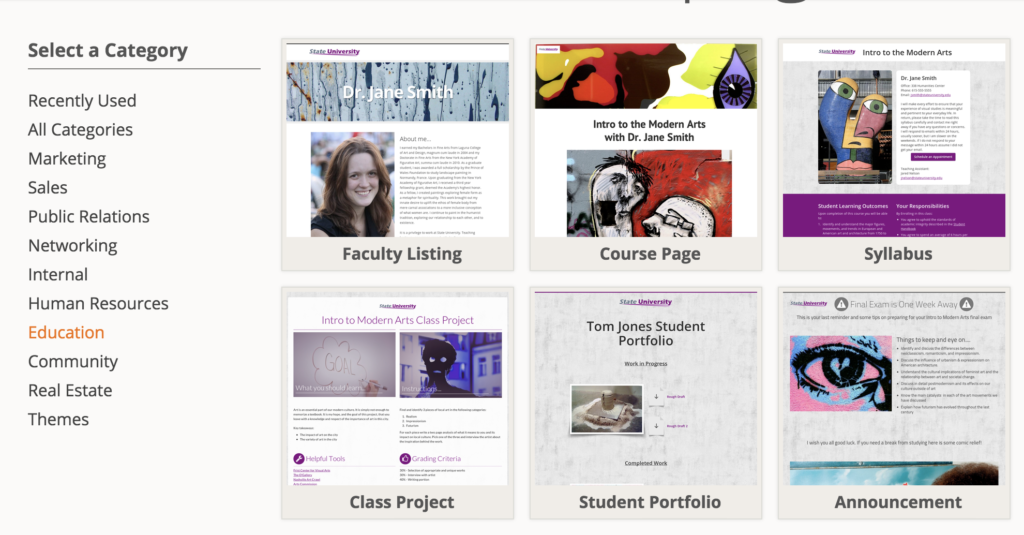
When creating a new page, Populr offers suites of templates based on categories. For example, the Education category includes Faculty Listing, Course Page, Syllabus, Student Project, Student Portfolio, and Announcement. Of course you can explore other categories and templates for the design that is closest to what you want. Once a template is chosen you begin the process of editing it and filling it with your content.

Here’s an example of a syllabus for an online class, created by Michelle Pacansky-Brock.

Strikingly

A slightly more contemporary aesthetic and it includes a blog so, for instance, you can create a home page with your basic information, then have a blog to announce updates or discuss new work.
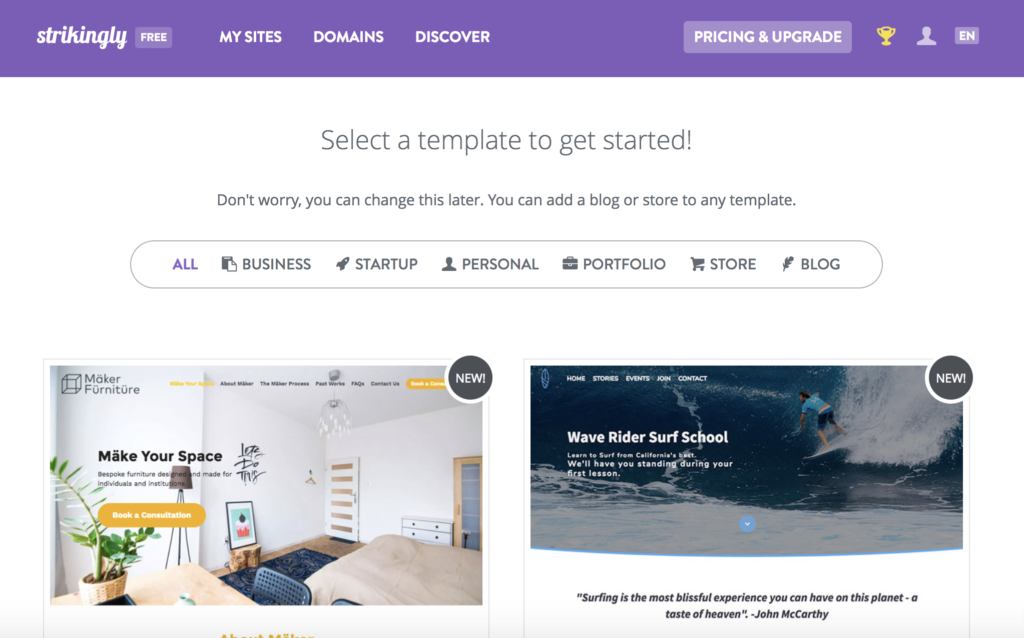
Dozens of portfolio examples can be found here.

Piktochart
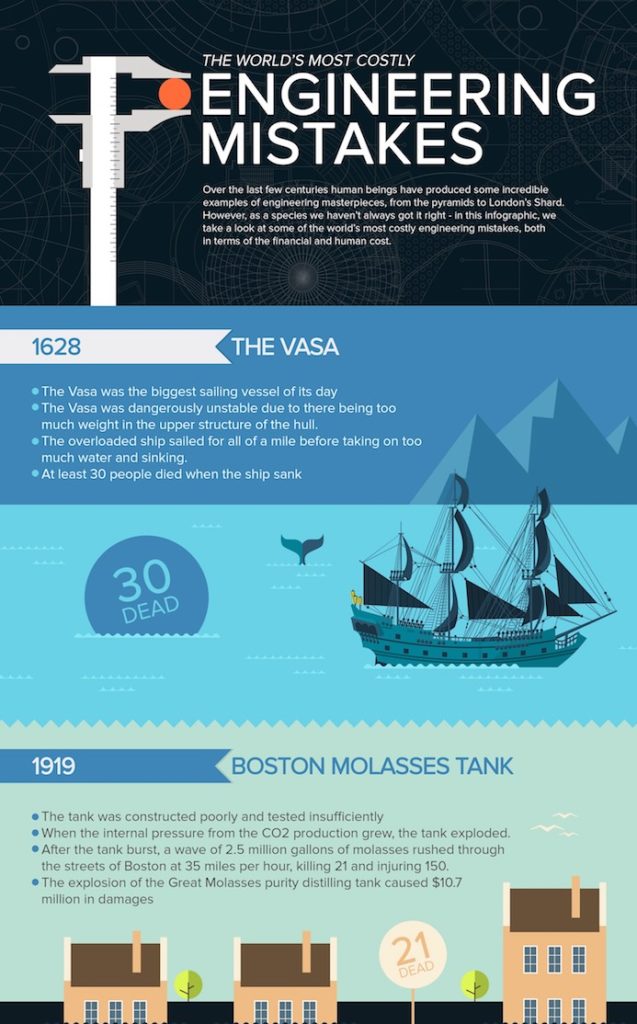
Especially useful for infographics, but can also be used to create printable posters, reports, and flyers, any of which can be downloaded as a jpg image or pdf file. You can even use it create a PowerPoint-like slideshow. You can save your creations as pdf and png, but not jpg files.

You can find many infographic samples here.

Canva
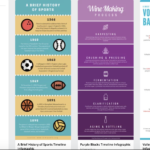
Similar to Piktochart though it uses a slightly different method, frames, for aligning images. Canva also let’s you save your creations as pdf, png, as well as jpg files. It includes short, easy, tutorials and there are many examples and tips like this one: https://www.canva.com/learn/50-brilliant-flyer-designs/

This image shows two infographic templates but there are thousands of other templates available, either free or for a small fee, for all kinds of documents or presentations.

You can learn more about these and other ways to create online materials on the Multimedia Tools on the Web page in the Teaching Resources area of our CTL website. Whether you are creating materials or you are interested in having your students create materials, we would be happy to speak with you about the possibilities.

Posted in CTL Home Page, Pedagogy, Promote to CTL Resource Page | Comments Off on Micropublishers

Scholarship of Teaching and Learning (SoTL) at UVM

Ever wonder if your curricular and instructional changes are achieving their desired outcomes? Curious about how students are approaching a complex assignment outside of class? Want to know what would make your class more engaging for students?

These are the kinds of questions that serve as the basis for the Scholarship of Teaching and Learning (SoTL), which is increasingly being used at institutions of higher education to support faculty members’ professional learning. In partnership with the Office of the Provost, the Center for Teaching and Learning (CTL) recently launched a pilot initiative to support SoTL at UVM. This blog post will provide a brief overview of SoTL along with a description of our pilot initiative.

What is SoTL?

SoTL is the systematic investigation of a question related to teaching or learning that aims to generate knowledge that can be used beyond individual classrooms to advance teaching and student learning. The SoTL research process typically begins with a question that faculty members have about their teaching or their students’ learning and progresses through the following steps:

  • Identify a question or problem to address
  • Review related literature to refine research question
  • Design data collection procedures to answer research question
  • Obtain research approval from the Institutional Review Board (IRB)
  • Collect data
  • Analyze data
  • Present and/or publish research findings

As a form of educational research, SoTL can involve qualitative, quantitative, and mixed methods approaches as well as case study, quasi-experimental, and experimental research designs. With these research approaches available, SoTL offers faculty members a way to systematically investigate and answer questions that emerge from their practice as teachers.

SoTL at UVM

Thirteen faculty members from across the disciplines at UVM are currently participating in our SoTL pilot initiative, which began in late-August 2017. We have representation from the Departments of Chemistry, Education, Geology, Global Gateways, Leadership and Developmental Sciences, Mathematics & Statistics, Nutrition and Food Science, Psychological Science, Rehabilitation and Movement Science, and Romance Languages and Linguistics.

Most faculty participants are in the process of designing their SoTL studies and working to obtain IRB approval to conduct their research. To support this work, CTL staff members created workshops and small learning community meetings for participants that were focused on the following topics:

  • Introduction to SoTL
  • Conducting literature reviews for SoTL research
  • Developing and refining SoTL research questions
  • Obtaining and maintaining IRB approval
  • SoTL research designs

Faculty participants will mostly collect their data during the Spring 2018 semester. Among the types of data that participants will collect are: student grades, student interviews, student survey data, and student work. CTL is planning to host a retreat in May 2018 when faculty participants will have the opportunity to work together to analyze their data.

The ultimate aim of this work for most participants is to publish their study findings in SoTL journals (e.g., College Teaching) or discipline-specific teaching journals (e.g., Teaching of Psychology or The Chemical Educator) so that they can share their research with scholars in their fields.

Please check back soon for another blog post about the specific projects on which faculty participants are working for the SoTL initiative.

Posted in CTL Home Page, Pedagogy | Comments Off on Scholarship of Teaching and Learning (SoTL) at UVM

What’s New in Bb?

As Fall has begun, take a moment to peruse the Fall 2017 Blackboard @ UVM newsletter.  Highlights in this issue include:

  • New Bb Mobile apps – one for students, and  one for instructors.
  • The Respondus Lockdown Browser pilot has been extended through the end of the Spring 2018 term.
  • Beginning of the term pointers, such as making your course available to students, how to merge course spaces, and a refresher on Bb’s date management feature.

All this, plus Bb’s new Achievements/Badging tool, pre-built rubrics, and more in this issue.

Posted in Blackboard Tips | Comments Off on What’s New in Bb?

Thinking About the Start of the Semester

As the air outside starts to cool, we begin to focus on the Fall semester and introducing our courses to the incoming class of students. You might be wondering what to keep in mind for the first day. Traditionally, students sit down and you review the syllabus on the first day and then they leave (sometimes a bit early.)

I would like to suggest making better use of the time on the first day by doing the following:

  1. Invite students to engage with you in a discussion of the syllabus.
    Have students divide into small groups. Each student within the group is assigned a portion of the syllabus to review and then have groups fill out a worksheet together about the specifics of the course. This allows students to talk with each other about the syllabus and later ask well thought out questions that their fellow students couldn’t answer.
  2. Clarify the expectations for classroom conduct.
    Ask students to make a list of behaviors that disrupt their own learning during class. They could do this individually and then create a list together that you agree upon as a code of conduct.
  3. Be clear in articulating the mode of communication you prefer.
    How do you like to get questions and how quickly you will reply to an email from a student or a discussion post in Blackboard. For example, students are on their phones so frequently checking email, they may expect that you are like that too. (Some faculty are like that, however, if that isn’t you, set the parameters.) For example, let students know if you only check in the morning and evening and that they should allow 24 hours before contacting you again. Also, if you want then to contact a Teaching Assistant first, be sure that information is clear to them.
  4. Be enthusiastic about the course!
    This is the first impression students will have of your course and how much you enjoy teaching it. Share your love of your content, because instructor enthusiasm is often cited by students as a catalyst for their learning.
  5. Have students create a personal goal for the course.
    After going over the course goals and the content of the course, have the students write down what they would like to personally get out of the course. They could record this writing on Blackboard in a journal, or as an assignment. Revisit this goal over the semester and ask them to track how they are progressing with it and if they need any additional resources from you to accomplish it.

We hope you enjoy your first week of class. Stop by to see us at the CTL during Dr Is In with any questions or feedback about the first week.


Posted in Pedagogy | Comments Off on Thinking About the Start of the Semester