
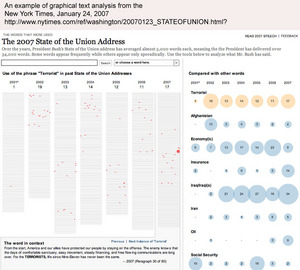
Text Analysis has long been a staple of the humanities computing diet. Its use, however, is not limited to scholars of literature. Here’s an example of how text analysis in a graphical presentation can provide some interesting data.
The New York Times has published a page that allows one to search President Bush’s State of the Union addresses for any keyword. It then displays the word count as a number and a graphic, and the location of the word in the speech. Clicking on the word’s location displays the word in context in its paragraph.
While this posting is making no political statements, it is easy to see how powerful visualizing words in this manner can be.
(Click for larger screen shot)
The page is at the NYTimes web site (free subscription required to view):
http://www.nytimes.com/ref/washington/20070123_STATEOFUNION.html?
-
Archives
- March 2018
- October 2014
- September 2014
- May 2014
- January 2014
- November 2013
- April 2013
- March 2013
- January 2013
- December 2012
- November 2012
- October 2012
- April 2012
- January 2012
- June 2011
- May 2011
- February 2011
- January 2011
- November 2010
- October 2010
- September 2010
- August 2010
- July 2010
- March 2010
- May 2009
- April 2009
- March 2009
- February 2009
- January 2009
- November 2008
- October 2008
- September 2008
- August 2008
- July 2008
- June 2008
- May 2008
- April 2008
- March 2008
- January 2008
- November 2007
- October 2007
- September 2007
- August 2007
- July 2007
- June 2007
- May 2007
- April 2007
- March 2007
- February 2007
- January 2007
- December 2006
- November 2006
- October 2006
- September 2006
- August 2006
- July 2006
- June 2006
- May 2006
- April 2006
- March 2006
- February 2006
- January 2006
- December 2005
- November 2005
- October 2005
- September 2005
- August 2005
- July 2005
- June 2005
- May 2005
- April 2005
- March 2005
- February 2005
- January 2005
- December 2004
- November 2004
- October 2004
- September 2004
- August 2004
- June 2004
- August 1998
-
Meta