
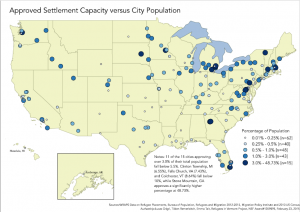
To understand the small to mid-sized cities and towns that many refugees are being resettled to, this project used WRAPS Annual Dataset as well as U.S. census data to look at 326 resettlement cities. Maps of these cities were made using the demographic characteristics and data from 2012-2015. Mapping placements for the FY 2012-2015 period confirms the trend towards smaller placements; it also illuminates the fact that as with other forms of migration, refugee resettlement is trending towards significant increases in migration towards these locations.
The maps below show approved resettlement locations by state and by city in
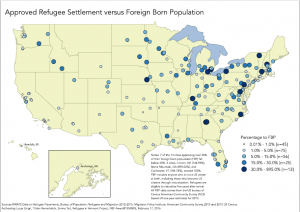
terms of absolute number of refugees, as a percentage of the overall population and as
a percentage of the foreign-born population for FY 2012-2014 and FY 2012-2015.
City Level:
City Settlement Capacity:
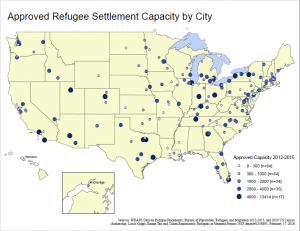 2012-2015 National City Capacity Map
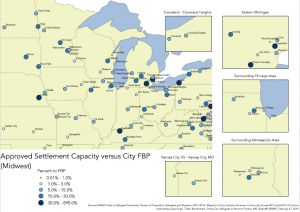
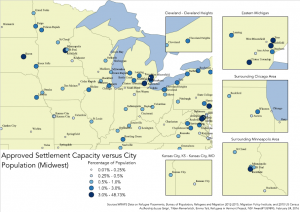
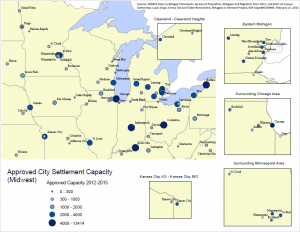 2012-2015 City Capacity Map: Midwest
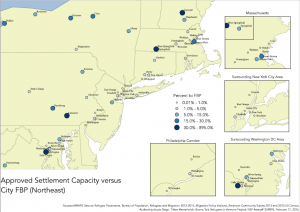
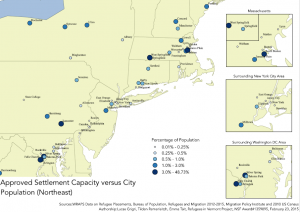
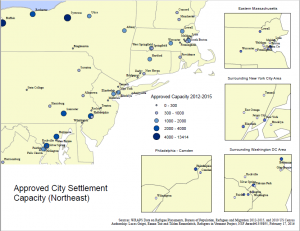 2012-2015 City Capacity Map: Northeast
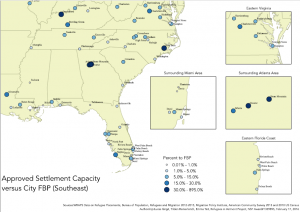
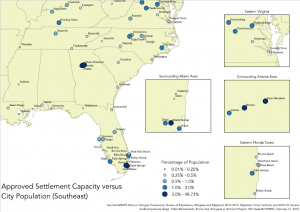
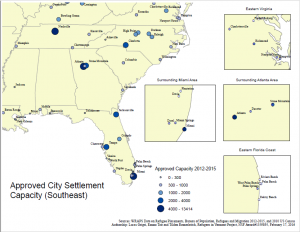 2012-2015 City Capacity Map: Southeast
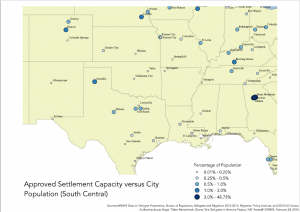
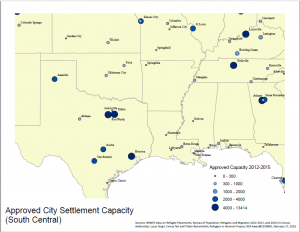 2012-2015 City Capacity Map: South
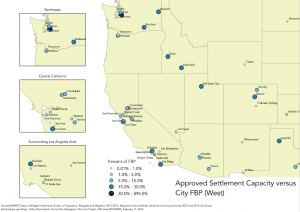
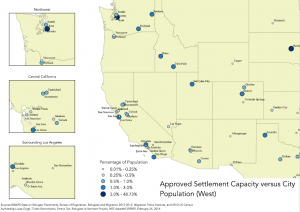
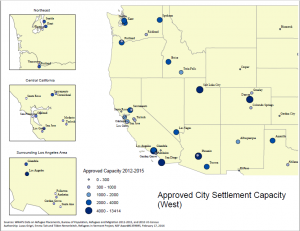 2012-2015 City Capacity Map: West
City Foreign Born Population:
 City Foreign Born Population: National
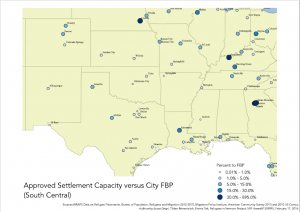 City Foreign Born Population: South
 City Foreign Born Population: Midwest
 City Foreign Born Population: Northeast
 City Foreign Born Population: Southeast
 City Foreign Born Population: West
City Population:
 2015 City Population: National
 2015 City Population: Midwest
 2015 City Population: Northeast
 2015 City Population: South
 2015 City Population: Southeast
 2015 City Population: West
State Level:
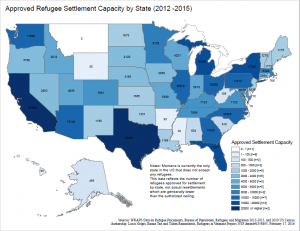 Approved Refugee Resettlement Capacity by State (2015)
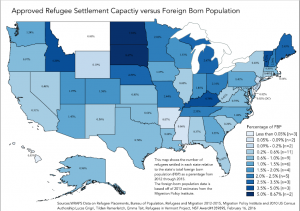 Approved Refugee Settlement Capacity versus Foreign Born Population
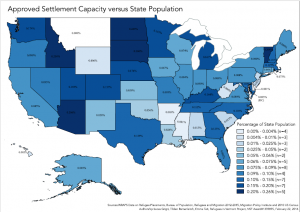
Approved Settlement Capacity versus State Population