INTRODUCTION: From improving soil health to pollinator habitat to protecting water quality, cover crops can provide a multitude of benefits! One way cover crops can protect the field from erosion and reduce nutrients from reaching our waterways is by covering the soil with their leaves and stems. This is called surface cover by cover crop and it is commonly measured as a percentage. Two tools typically used to measure percent surface are Canopeo and normalized difference vegetative index (NDVI).
- Canopeo is a phone application was developed by Oklahoma State University App Center. A picture is taken with a cellphone or a camera and uploaded into the application. Canopeo then calculates the percent of fractional canopy cover e.g. the amount of soil surface covered by green. Users can determine how many pictures to take to get a representative sample of the field’s percent cover by cover crop.
- NDVI uses satellites and near infrared technology to measure the density of green in an area. NDVI can be used to measure the percent cover of cover crop for an entire field versus Canopeo’s representative sample points. So, the question is, how well do these two methodologies compare?
METHODS: In 2020 and 2021, 10 pictures were analyzed by Canopeo and one NDVI measurement (using either Landsat 8 or Sentinel 2 satellites) were taken on cover cropped fields in the northwestern area of Vermont. In 2020, 30 corn fields were interseeded with a mixture of annual ryegrass (76%), radish (5%), and clover (18%) planted at a rate of 26.5 lbs/acre. In 2020, the Canopeo measurements were taken between 22-Oct and 27-Oct and the NDVI measurements in 2020 were taken between 5-Oct through 17-Dec. In 2021, 15 corn fields were interseeded with a mixture of annual ryegrass (59.5%), clover (20.0%), vetch (11.9%), and radish (7.96%) at a rate of 26.5 lbs/acre and another 13 fields were planted with a mix of winter rye (49.0%), annual ryegrass (35.9%), clover (10.0%), and radish (3.98%) at a rate of 50 lbs/acre. In 2021, the Canopeo measurements were taken between 27-Oct and 9-Nov and the NDVI measurements in 2021 were taken between 11-Oct through 16-Oct.
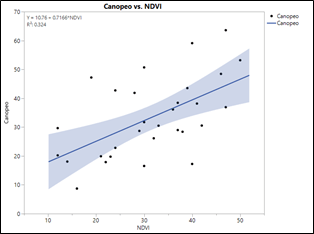
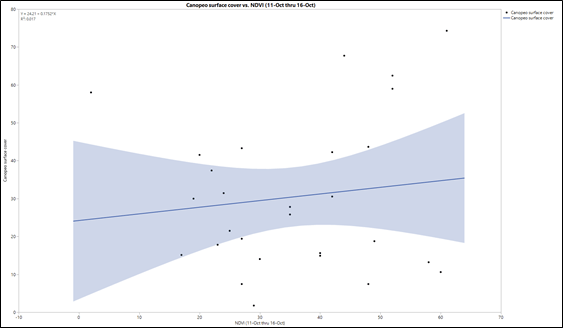
RESULTS: In short, there was relatively little correlation between NDVI and Canopeo data in 2020 and in 2021. In 2020, 32% of the Canopeo measurements can be explained by the NDVI measurements (Figure 1). There was not enough data to determine if degree of correlation changed based on measurement dates. Overall, little growth is assumed to have occurred in November, 2020 as there were only 4 growing degree days, based on weather data from a Davis Instruments Vantage Pro2 with WeatherLink data logger. In 2020, the Canopeo mean measurement was 1.98% above the mean NDVI measurement, but this difference was not statistically significant (p>0.3835). In 2021, 1.7% of the Canopeo measurements can be explained by the NDVI measurements (Figure 2). In 2021, the NDVI mean measurement was 5.19% above the mean Canopeo measurements, but this difference was not statistically significant (p>0.2454). When correlations between Canopeo and NDVI are analyzed by cover crop mix, there were no significant correlations between NDVI and Canopeo measurements.
CONCLUSION: Due to high variability, there was little correlation between NDVI and Canopeo measurements. This indicates that these two methodologies cannot be used interchangeably. Overall, NDVI may be the preferable tool due to its ability of NDVI measurements to quickly reflect the surface cover of an entire field remotely versus capturing user determined data points on a smaller scale in the field. However, there are advantages and disadvantages to the tools. With both, there can be software malfunctions. For example, the Canopeo application may fail to initialize and not load properly while in the field and it may fail to store the percent cover analysis in the cloud. It is recommended to write-down the Canopeo analysis from the app onto paper after each picture is capture. Collecting Canopeo data takes longer and requires a field visit. NDVI measurements can be collected remotely with a computer for almost any date. However, there may be gaps in NDVI measurement on specific days or date ranges due to NDVI system malfunction. With Canopeo, there is more user control and assurance that the data is collected on the preferred day.
Learn more about cover crops and soil health practices on the UVM Extension NWCS Cover Crops and Reduced Tillage webpage.
Author: Lindsey Ruhl, Research Specialist, UVM Extension Northwest Crops and Soils Program.