From story maps, timelines, stories, and other traditional techniques to unfamiliar strategies like cartooning, I’m exploring a lot of different tools in visualizing past American childhoods. Here are a few examples…
- A timeline of key laws, social and economic changes, and events related to American childhoods from the late 19th and early 20th centuries.
- I went to a cartooning workshop last fall! I’m not an artist but it was great to think about my work in a different mode and the facilitator was terrific at showing us the basics of panels, narrative, and using Sharpies. Here’s an example of a fictionalized version of a real family’s situation, based on my research on records from the Home for Destitute Children in Burlington, VT.
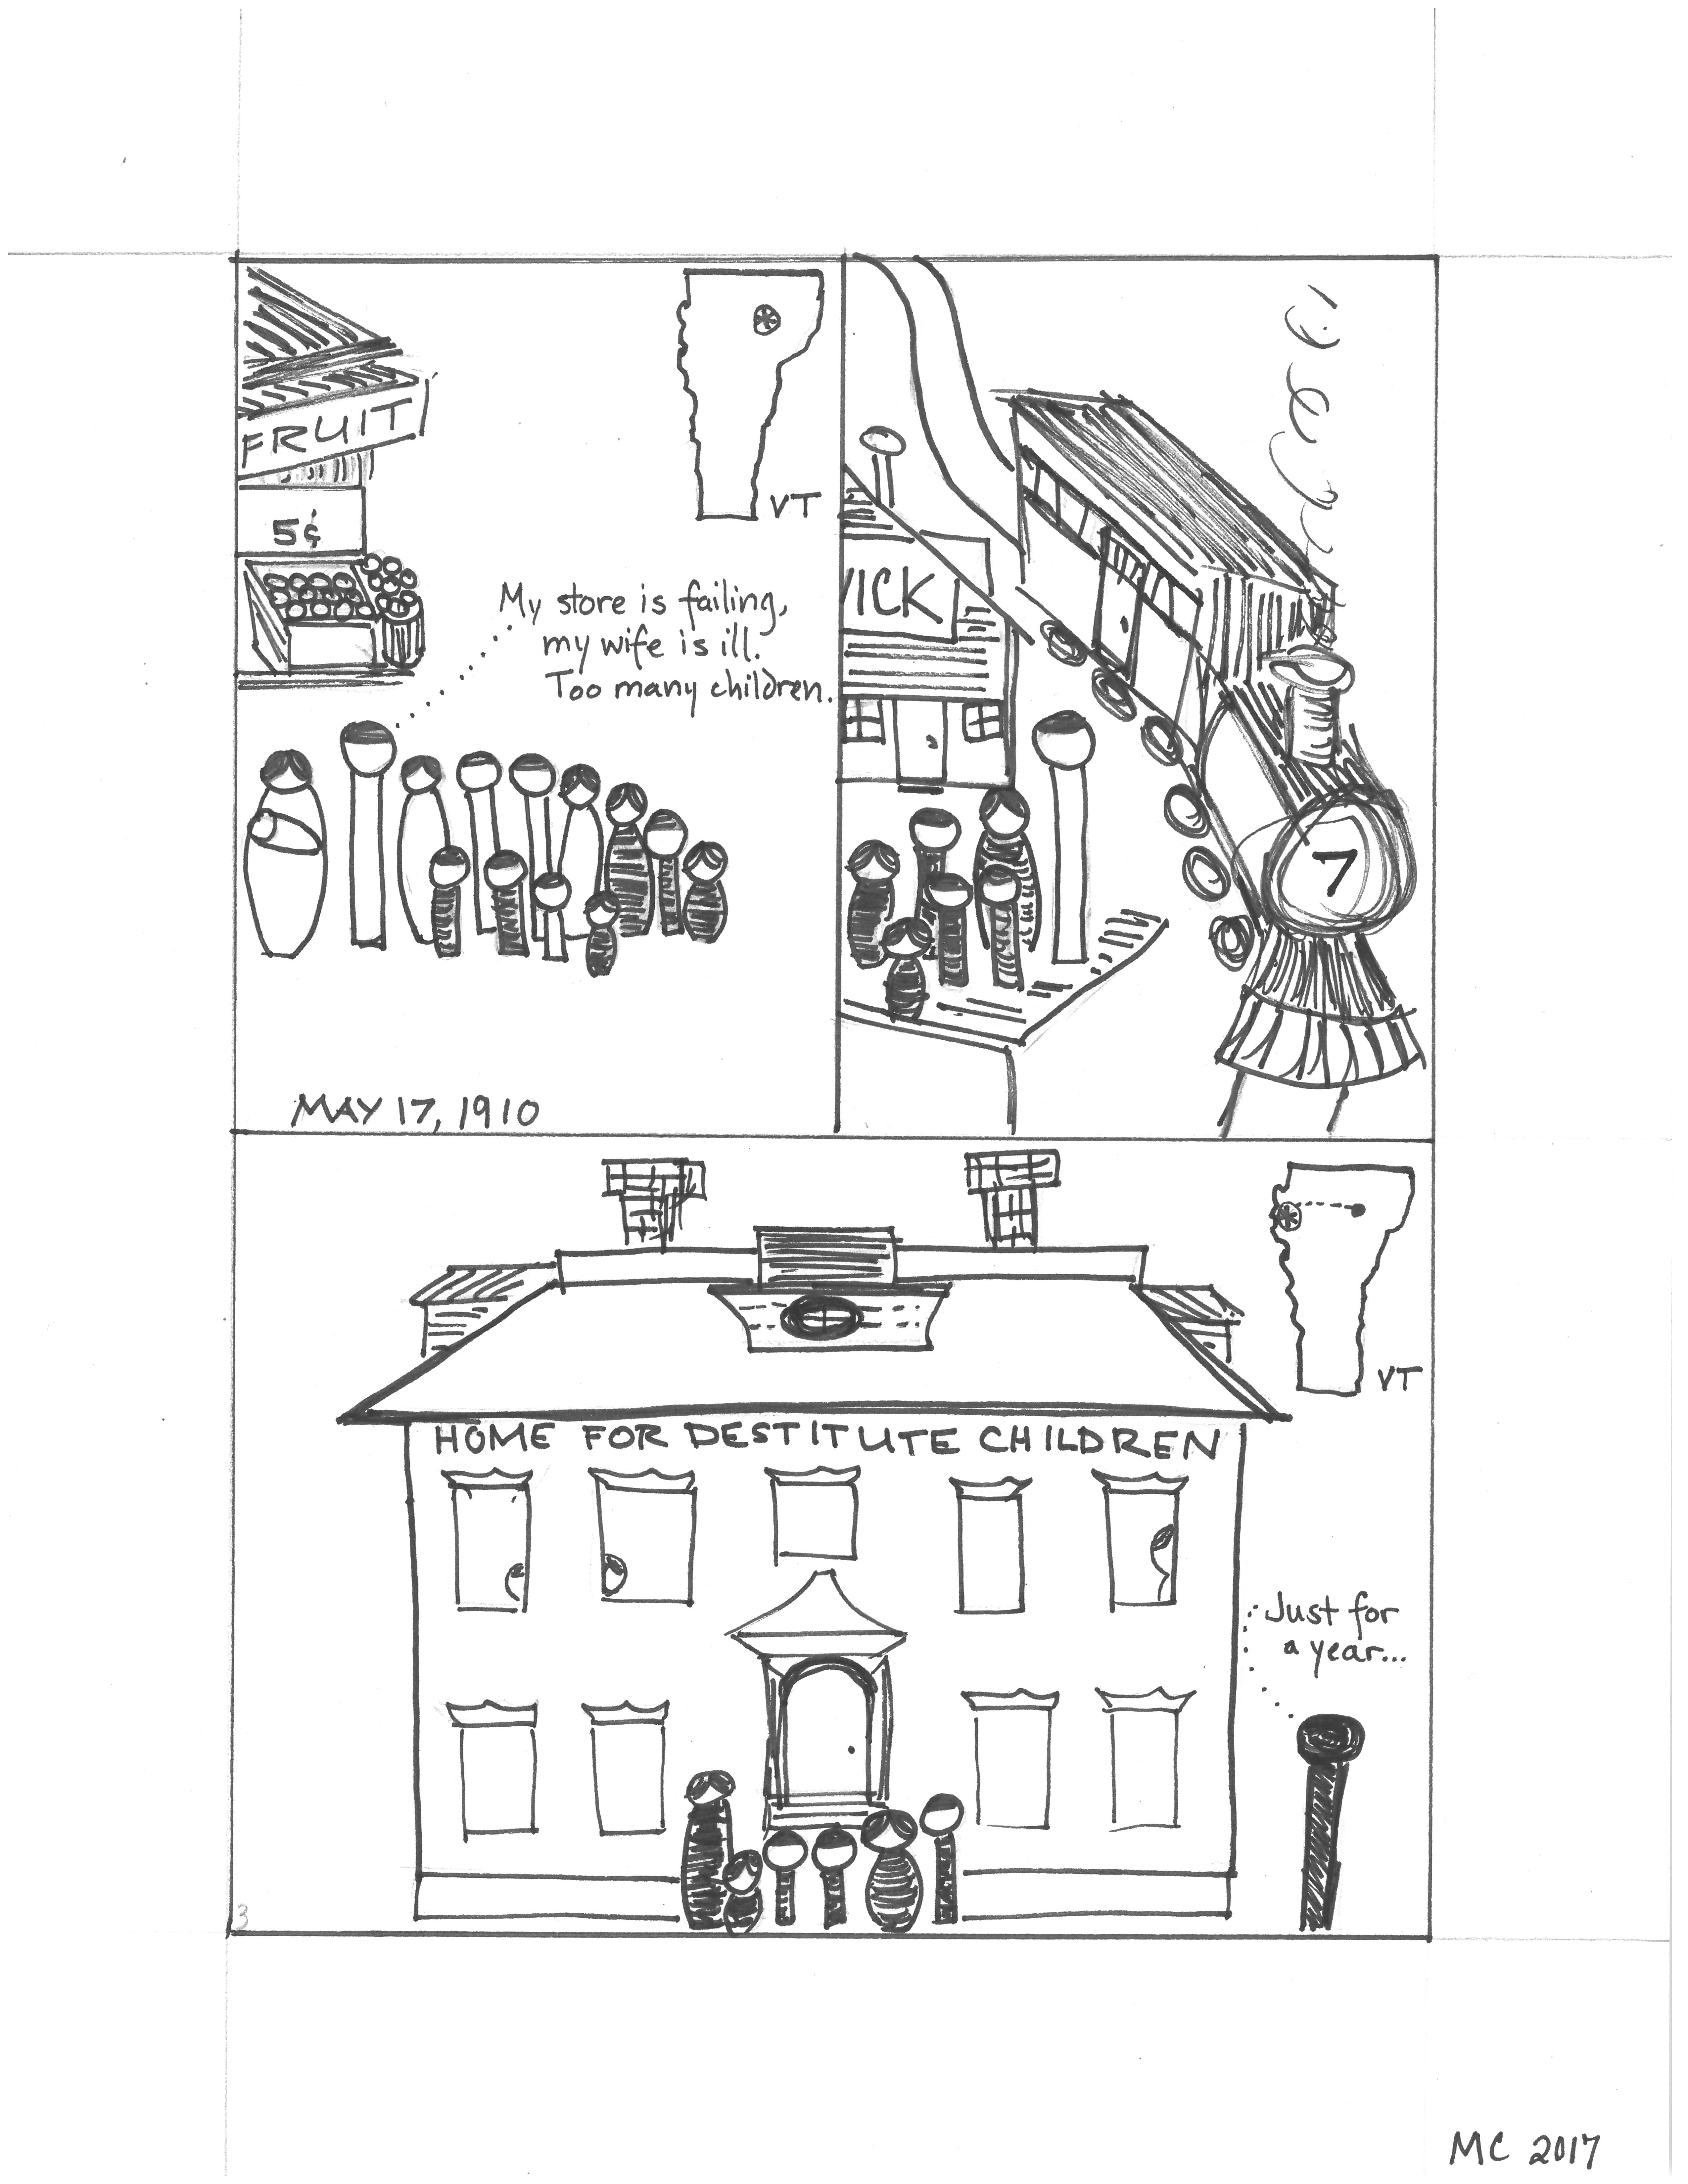
A representation of one family’s situation before the arrival of their children at the Home for Destitute Children.
3. Social Explorer is great for quick, easy maps of key social data as represented in the US Census. Of course, all the usual caveats about the meanings, absences, and biases of the census apply, but this map shows school attendance among children aged 7-13 in 1920.
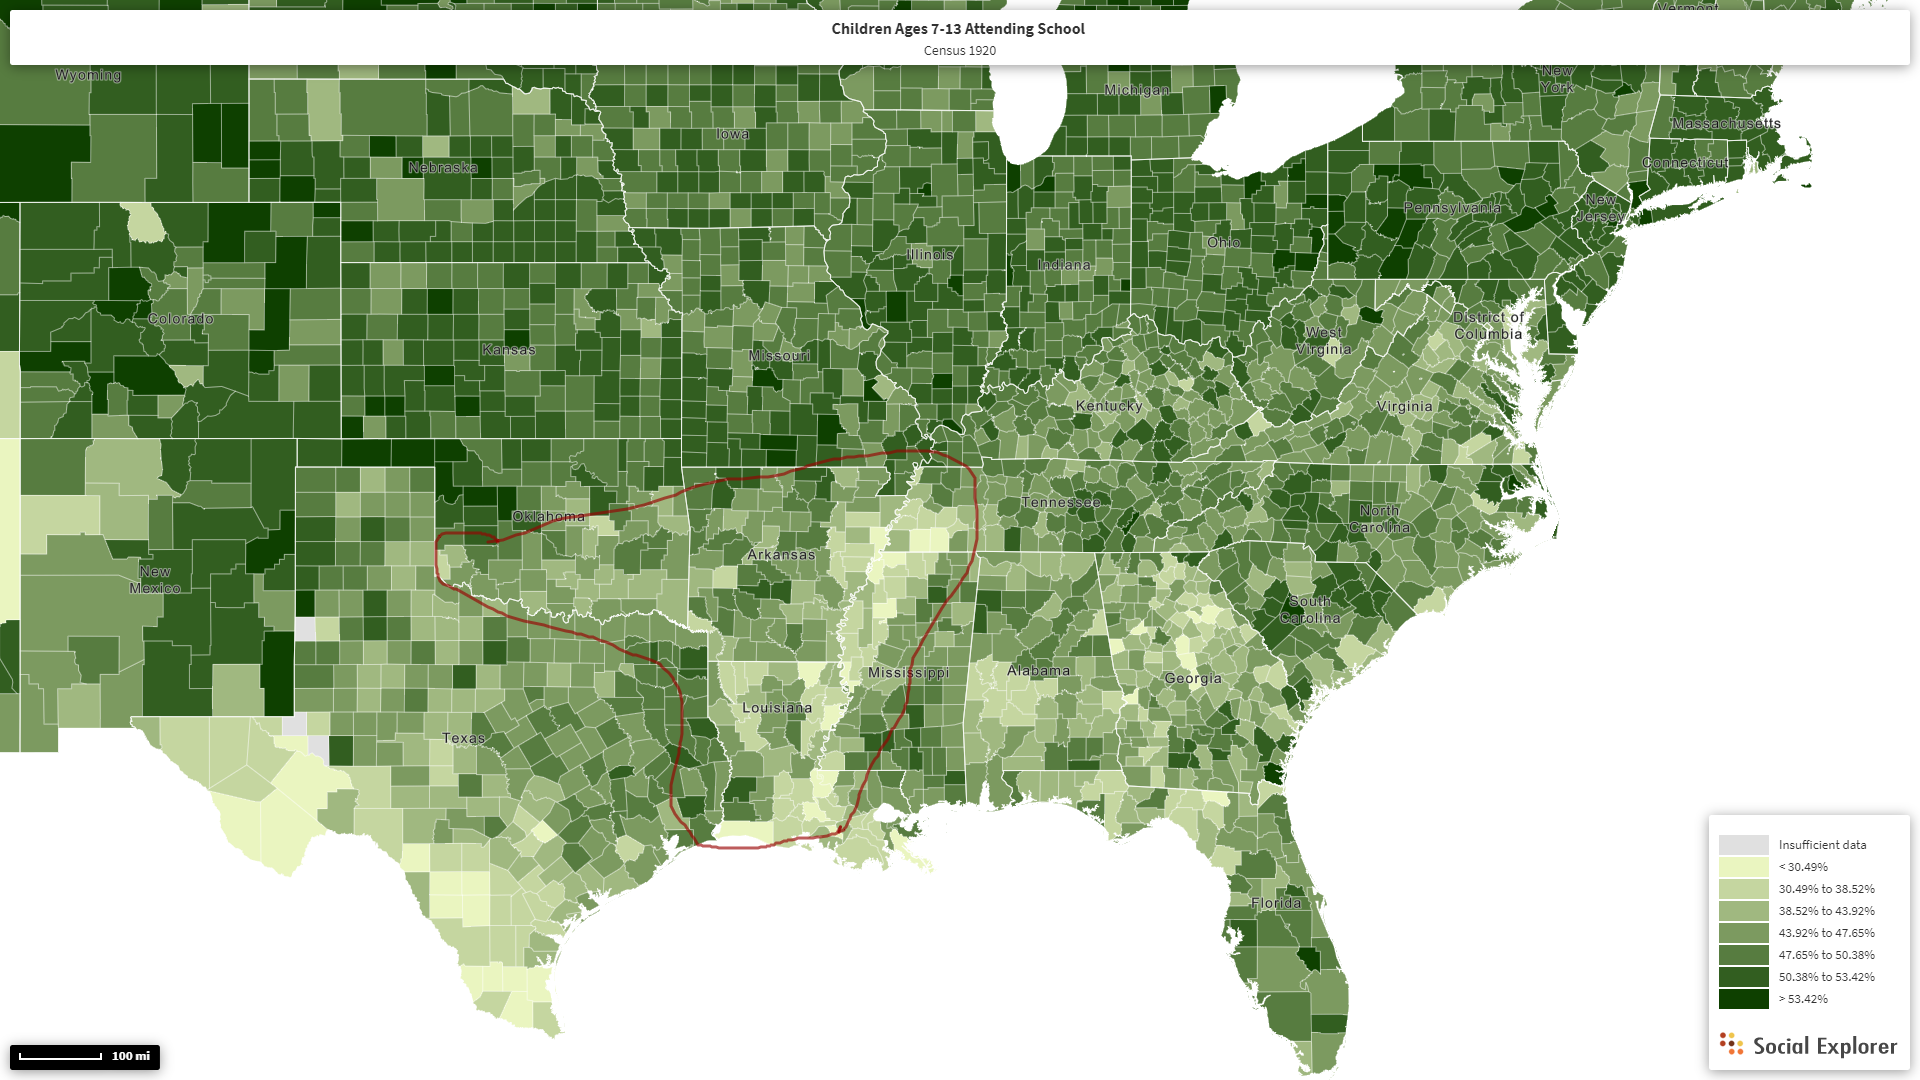
School Attendance of Children Ages 7-13; 1920. US Census data via Social Explorer