Home | Introduction | Literature Review | Data and Analysis | Conclusion | Sources
Data and Analysis
Socioeconomic Status and Health
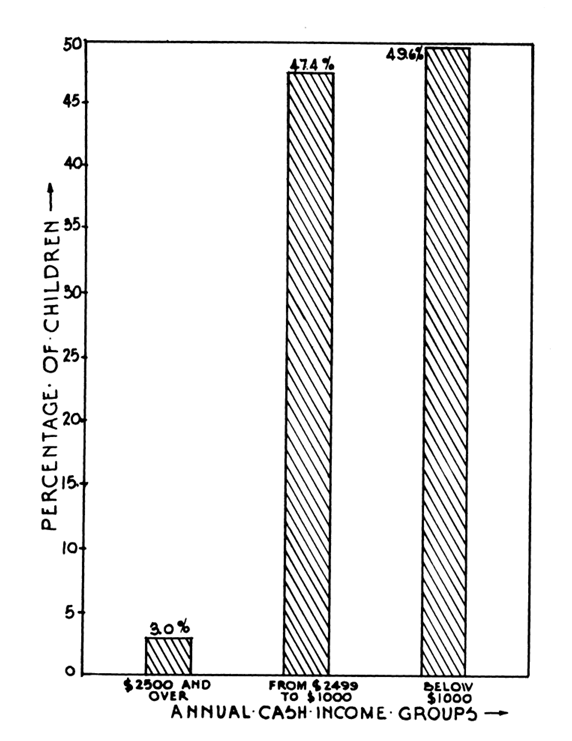
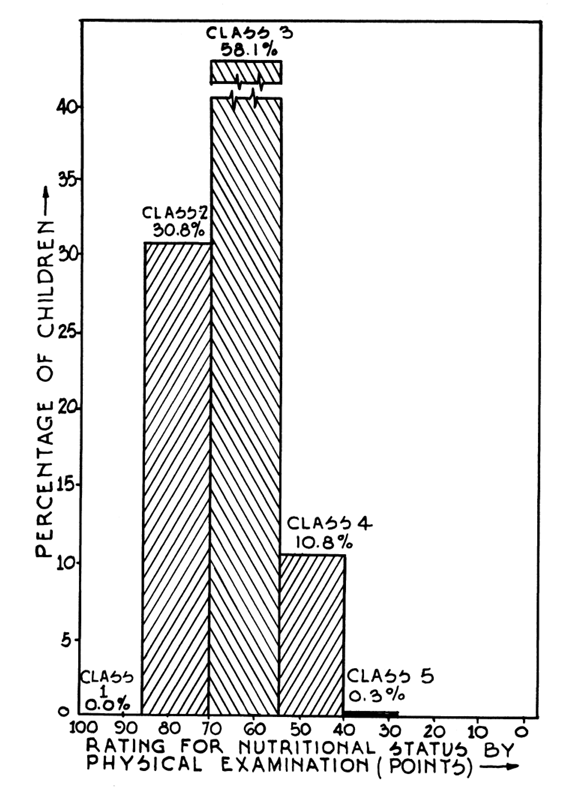
Percentage Distribution of Children with Respect to Annual Cash Income and Percentage Distribution of the Children as to their appearance of Nutritional Status by Physical Examination (Zayaz, 1940) https://www.jstor.org/stable/1125409
The chart above to the left shows the annual family income for children participating in a study investigating the relationship between children’s health and socioeconomic background. Throughout the study, Mack and Smith, the researchers, describe socioeconomic status by annual income and family education history. The chart to the left demonstrates that a large portion, 49.6 percent, of the children participating in this study are in the lower class. The chart to the right depicts classifications of the children’s rating for nutritional status by a physical examination. The classifications are as follows: Class I, Exellent, represents individuals in optimal health with no signs of nutritional deficiencies or excesses; Class II, Good, indicates generally good health with minor deviations from optimal nutrition that are not considered clinically significant; Class III, Fair, denotes noticeable signs of subpar nutrition, such as minor deficiencies or borderline malnutrition; Class IV, Poor, indicates a clear deficiency state with marked physical symptoms, such as stunted growth, signficant weight loss, or visible signs of malnutrition; and Class V, Very Poor, represents severe malnutrition or a critical nutritional deficiency. Individuals in this category often have life-threatening conditions requiring immediate intervention.
To relate the finding of childhood health and socioeconomic status, the report accompanying this study found that “the family cash incomes were apparently related” to the responses to the following tests:
- Appearance of Nutritional Status by Physical Examination – the average points were higher for Income Classes A and B combined than for Class C, and Classes D and E combined. There were no significant differences, however, between the averages of Class C and of Classes D and E combined.
- Skeletal Status – The average classes for all three skeletal status factors for children within the different income groups became progressively poorer as the income classes became lower.
- Hemoglobin Status – The average grams of hemoglobin per 100 c.c. of blood was 12.04 for Income Classes A and B combined, 11.51 for Income Class C, and 11.04 for Income Classes D and E, combined. A highly significant difference was shown between Income Classes A and B combined, when compared with D and E combined, with odds greater than 100:1 that the difference did not occur by change.
- Darkness Adaptation Status – A tendency toward a lower average biophotometer rating with a lower income was shown for all of the biophotometer factors used. The greatest difference, however, was established between the darkness regeneration factor, or the response to the test at the end of the 10-minute darkness regeneration period (Zayaz, 1940)
In order to tackle the health disparity between socioeconomic classes, school lunch programs were implemented, such as the “penny lunch,” which offered cheap, accessible, and nutritious meals for children who may not otherwise maintain a healthy diet. Even beyond the clear relationship between socioeconomic status and child health, Mack and Smith observed concerning levels of malnutrition in general, with a significant portion, 69.2 percent, of the child population falling into the “Fair” (Class III) or worse categories, as displayed in the chart above. In fact, none of the children they examined met the “Excellent” classification. School lunch programs would be an opportunity to nourish all children.
School Lunch Programs and School Attendance
https://www.socialexplorer.com/a9676d974c/view
https://www.socialexplorer.com/a9676d974c/view
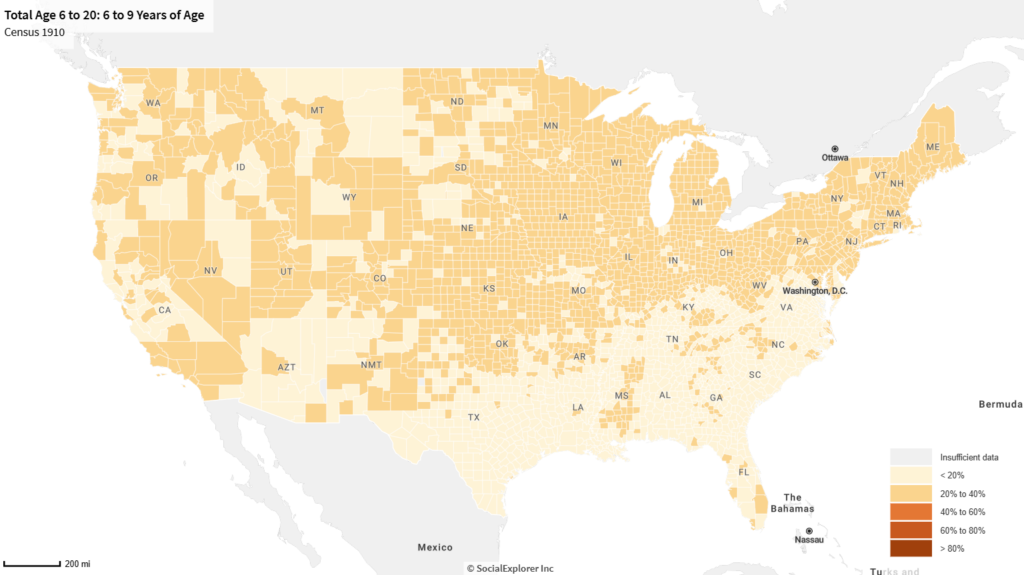
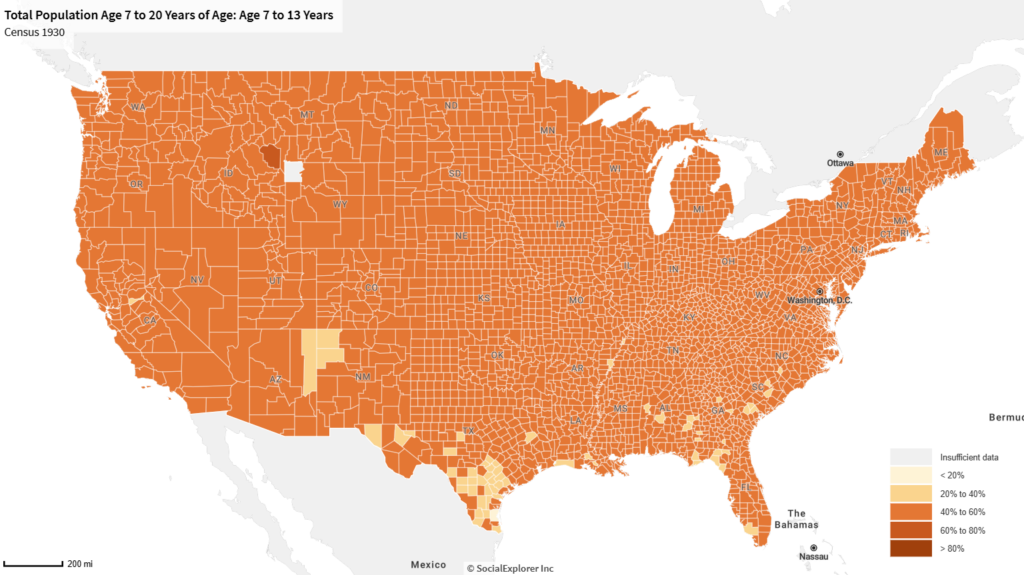
The maps above demonstrate that between 1910 and 1930, there has been an increase in school attendance in children between the ages of 6 and 13. While there are several factors that may contribute to this growth in attendance rate, we can use this map to support the notion that there is a relationship between schools providing lunch and school attendance. In 1908 New York City, malnutrition was reportedly an “increasing visible public health concern and common explanation for school children’s truancy, inattention, behavioral problems, and poor academic performance” (Ruis, 2015). After the implementation and growth of school lunch programs designed to tackle malnutrition, there was an observed increase in school attendance.
https://hdl.handle.net/2027/umn.31951000766296n
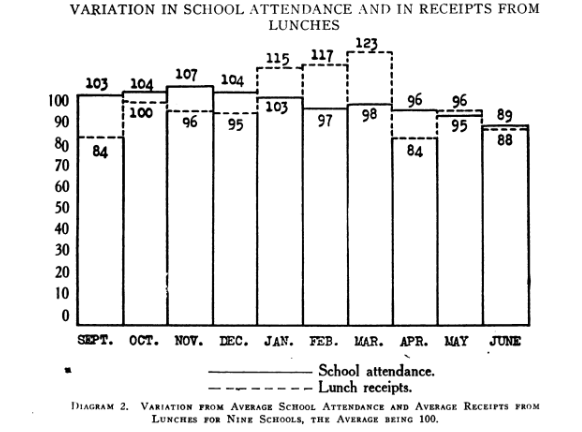
The chart above depicts a relationship between school attendance and lunch receipts in the 1913-1914 academic school year. The highest recorded lunch receipts occurs in the months January, February, and March. This could suggest that the availability of school lunches may serve as an incentive for students to attend school regularly, particularly in colder months when access to a warm meal at school may have a strong appeal. While this chart alone does not establish causation, it supports the broader argument that providing school lunches positively impacts attendance. National Education Association spokesman Dr. Howard Dawson said,
“A school lunch program … is more than feeding children. Nutrition should be … fundamental in the educational program and should be administered according to the proper pattern” (Levine, 2008).
The notion that the opportunity of school lunch improved school attendance demonstrates Dr. Dawson’s proclamation that nutrition is fundamental for education. Similarly, Georgia senator, Herman E. Talmadge, said,
“We must use food as a tool of education. A child cannot learn if he is hungry” (Gay, 1996).
Dawson and Talmadge are just but two examples of a common theme: public concern for not just the education, but also the general health and wellbeing of children. Steven Mintz discusses this concept in his book chapter “Save the Child.” He describes the romanticized view of children as pure, innocent, and angelic beings. And thus, adults feel an obligation to protect children.
Urban Focus on Meal Programs
https://www.jstor.org/stable/j.ctt1q1cr7t.6
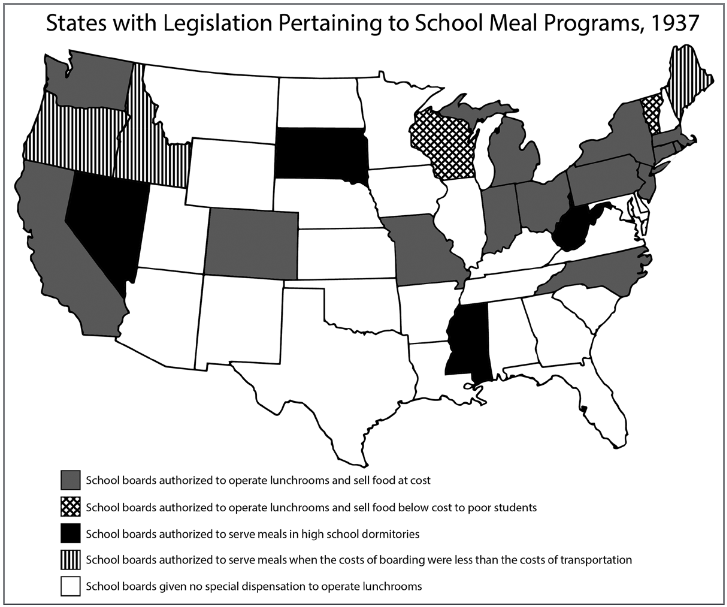
Above, I discussed Mintz’s theme of the idealization of childhood, and the desire to protect children. As he discussed the broader theme of adults projecting an angelic nature onto children, he also noted that “fixated on urban problems, the child-savers neglected rural children” (Mintz, 2004, p.155). The implemented school lunch programs had a clear inclination towards urban locations. The map above shows the legislation regarding school lunch programs across states in 1937. In this map, we can see a pattern of legislation existing in states that contain significant urban locations. Notably, New York is one of 14 states in which school boards are authorized to operate lunchrooms and sell food at cost to all students. New York City was a key place to the development of the penny lunch program and thus the integration of broader school lunch programs. It should also be noted that Pennslyvania, home to the Mack and Smith study reported by Zayaz above, also has legislation allowing school boards to sell lunch at cost, perhaps a consequence of the conditions of the study examined above.
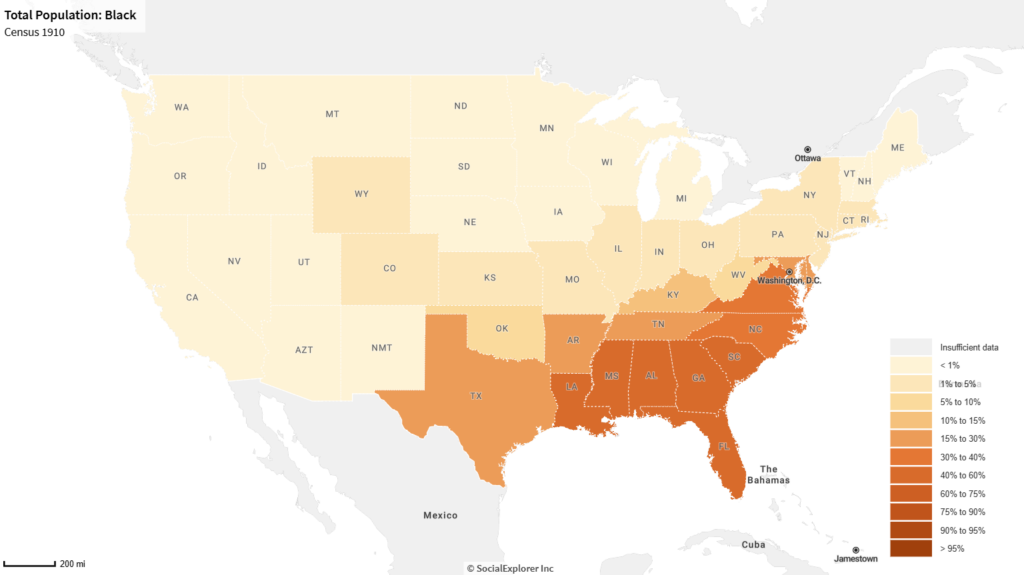
To further delve into the comparasion between urban and rural locations, we can reference the above 1910 map of school attendance for children ages 6 to 9. There is a clear pattern of the rural south having a lower school attendance than northern urban locations. This divide also aligns with the historical population of black Americans in the South.
https://www.socialexplorer.com/a9676d974c/view
This map depicting the location of black Americans aligns with the 1937 map showing a pattern of lack of legislation permitting school boards to provide meals. This suggests that school systems may not be as well-mainted in the south, in particular, black schools. Mintz writes that, “many child-savers were guilty of paternalism, class and racial bias, xenophobia, and double-standards regarding gender” (Mintz 2004, p.155). By examining which schools and which geographies received government support through the school system’s meal programs, we can understand the racial bias implemented in the programs.
Opponents of the school lunch program argued that food access was a “private, not a public, responsibility” (Ruis, 2017). These opponents describe government intervention as a step towards a socialist society. In a social context of an increased American fear of communism, opponents use this fear to deter such government programs. Mintz describes that there “there was always a dialectic between the child-savers and the people they wanted to help, with poor children and their parents using child-saving institutions for their own purposes” (Mintz, 2004, p. 155). This hestiency to aid the poor had a particular focus on black Americans, as supported by the maps above, and thus they did not reap the same extent of the benefits of school lunch programs as white Americans, in particular, white Americans living in urban locations.
