Feeds:
Posts
Comments

This year’s assessment fair was a great success.  Thank you to all of the departments who put together a poster for the fair!  Here are some of the posters from the fair:

ACCESS

Career Services

Center for Health and Well Being

Center for Student Ethics and Standards

DOS – Students Use of Technology

NCHIP

Office of Student and Community Relations

Student Life – BORED

Student Life – Cats at the Movies


Thank you to Dr. John Ryan, Director of Institutional Research for his great presentation at our recent assessment fair.  His presentation was a great overview of the National Survey of Student Engagement (NSSE), a peek at the UVM specific results, and some suggestions for putting it the results for practice.

You can see NSSE Presentation Assessment Fair 2013.

If you would like more information about the NSSE survey please go to Institutional Research’s website.

This survey was adapted from a social media survey developed at the University of Michigan.  The goal of the survey, administered to undergraduate students in fall 2012, was to understand students’ use of social media to inform our practice.

Below are some of the key findings:


Over 50% of students indicated that they currently use the following social networking tools:

  • Facebook (93%)
  • You Tube (84%)
  • Pandora (64%)

Other top social networking tools:

  • Twitter (40%)
  • RateMyProfessors (37%)
  • Instagram (35%)
  • Pinterest (27%)

80% of respondents agreed with the statement: “who you are and what you value are reflected in your profile”

92% of respondents used the internet sites to watch T.V.

98% of respondents indicated that they owned a laptop, 66% owned a smartphone, and 20% owned a tablet.

3 top preferred email platforms

  •   41%   Gmail
  •   39%   UVM Webmail
  •   5%  Apple (iCloud)

Incoming class of 2013

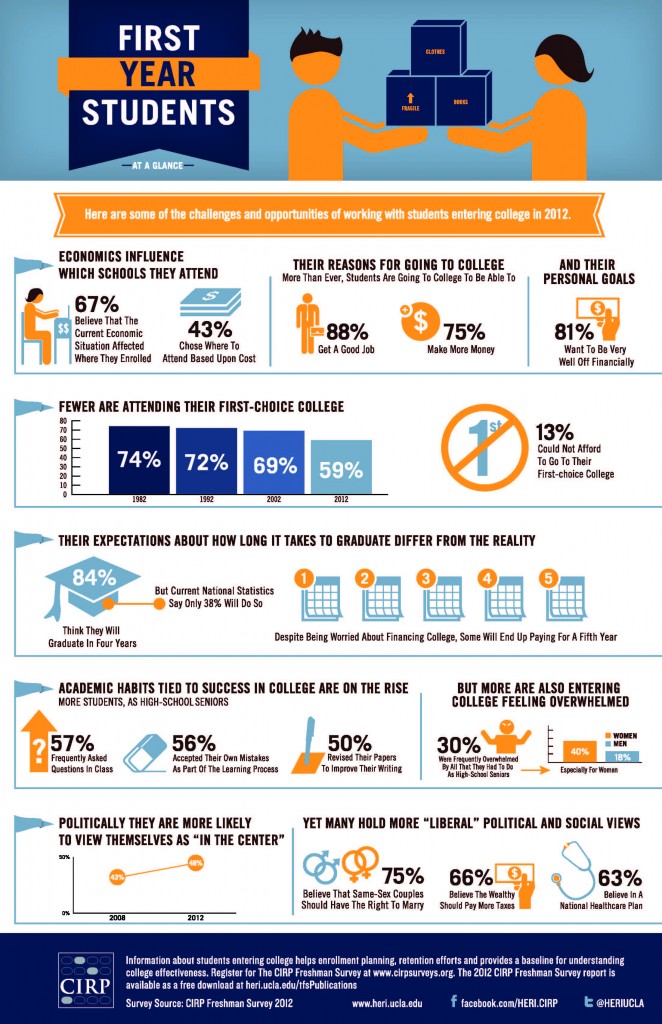
The Higher Education Research Institution (HERI) has provided the following info-graphic of the incoming class of 2013.  What changes have you seen over the last few years in higher education?  What surprises you most about this graphic?


Every two years, the Dudley H. Davis Center deploys a campus-wide assessment.  This comprehensive tool surveys community members to help us better understand their attitudes and experiences related to the University’s student center’s programs, services and facilities.  Most recently administered in April, 2012, the Davis Center Biennial Survey is a critical element of our continual improvement processes.  You can learn more about the Davis Center via our Annual Report.  On this blog, we’ll continue to share snippets of important data we gathered from this survey.

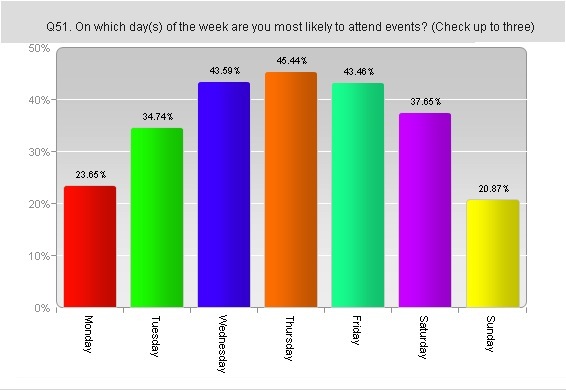
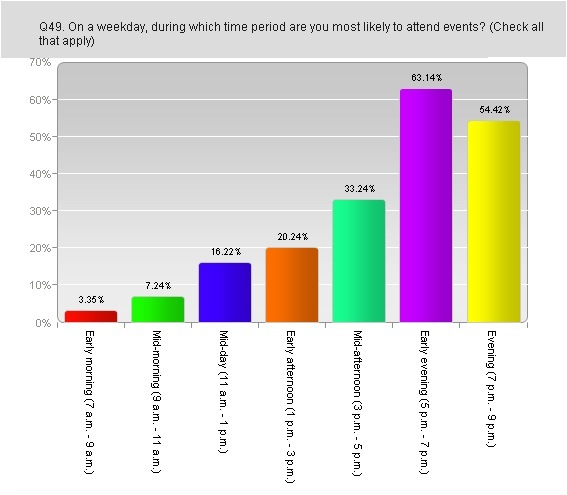
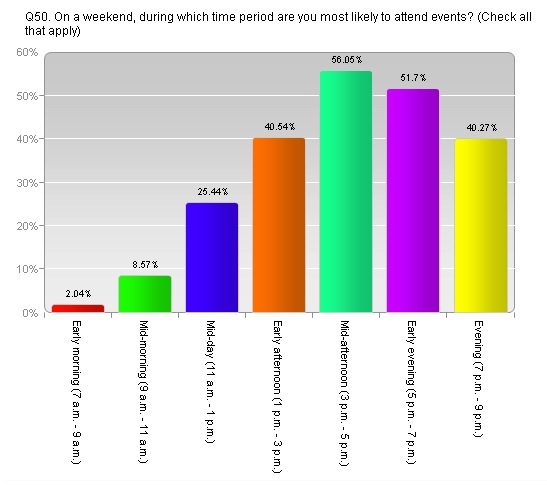
One compelling data set from this survey reveals important information to event planners and programmers on campus.  As the hub of the student experience, we wanted to learn more about the days and times our students preferred to attend events.  The charts below reveal some important trends about student preferences.

Graph of the Davis Center Survey Results

Students trend toward the middle of the week when asked which days they would prefer to attend events.

Graph of the Davis Center Survey Results

On weekdays, students prefer evening programing more than they do on weekends. The 5 PM to 7 PM and 7 PM to 9 PM time blocks are a clear winner with students.

Graph of the Davis Center Survey Results

On weekends, students prefer afternoon evening events. Over half of the respondents indicated that they preferred the 3 PM to 5 PM and 5 PM to 7 PM time blocks.


Welcome to the Catamount Pulse

Welcome to the Catamount Pulse where we will feature great assessment work around the University.  This will be a source of information about the students, programs, and services at the University of Vermont.  This fall we have a lot of great assessment efforts underway which will be featured on the blog.  Here are a few upcoming posts:

  • Annual Report for the Division of University Relations and Campus Life!
  • National Health Improvement Project: UVM is participating in this project to reduce the harms associated with high risk drinking.  Currently, we are doing a monthly survey to better understand students participation in high risk drinking.
  • Social media: Goal of this project is to understand students use of social media including Facebook, Twitter, Hulu, and even QR scanners
  • CIRP: Each summer at orientation students complete the CIRP survey.  We hope to have a quick summary of some interesting results to the CIRP survey soon!

Skip to toolbar