

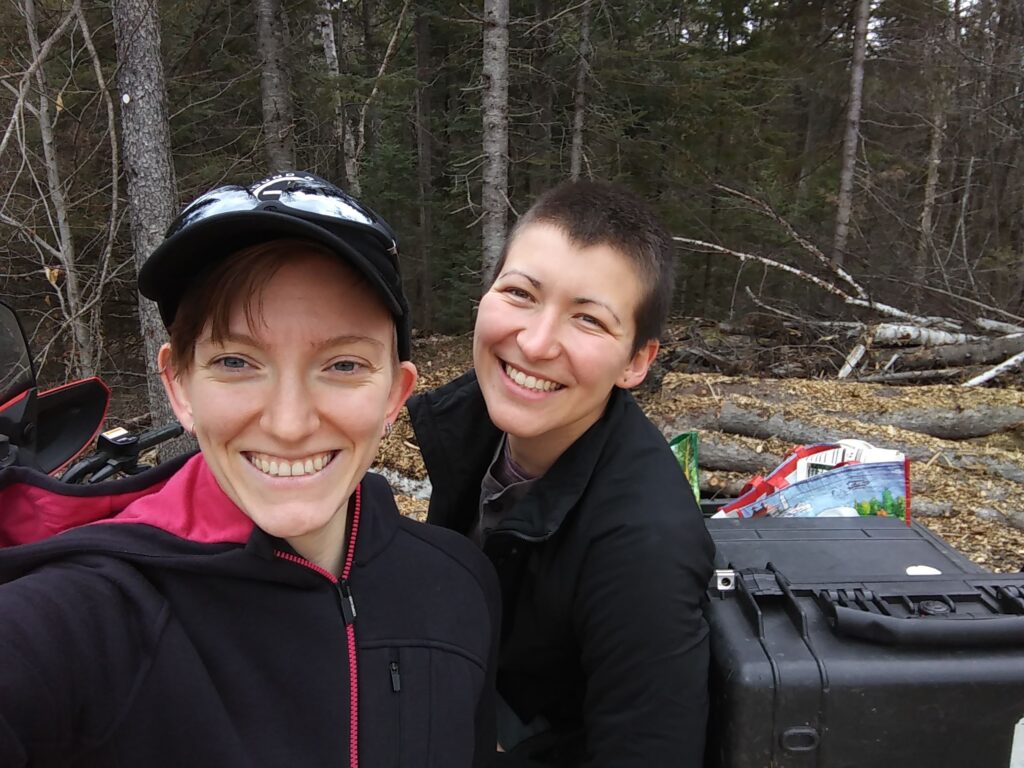
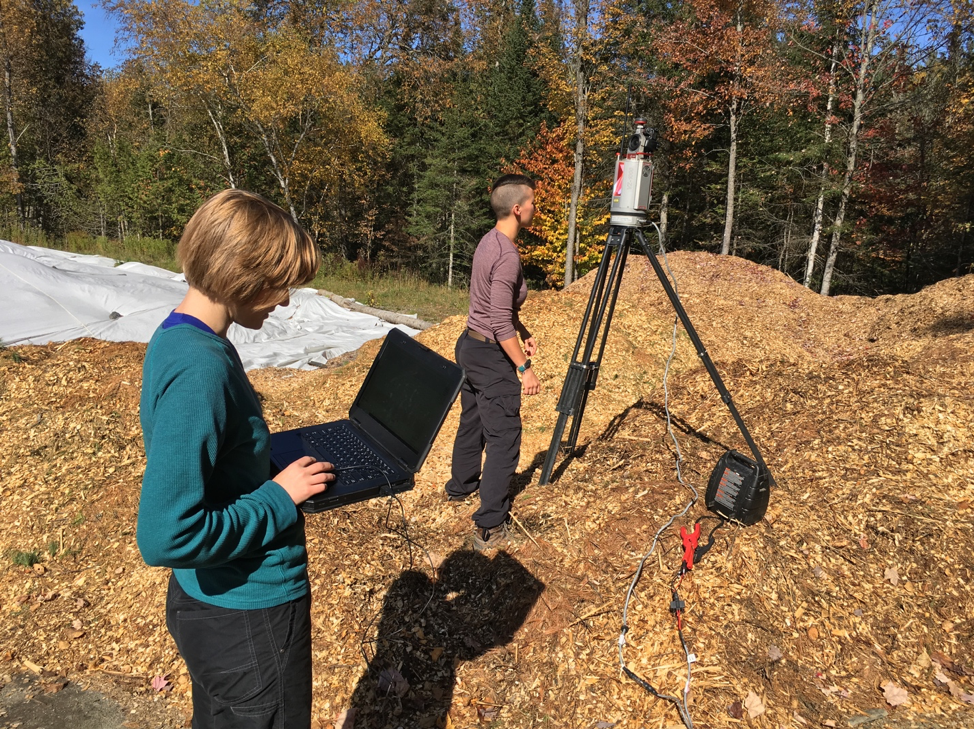
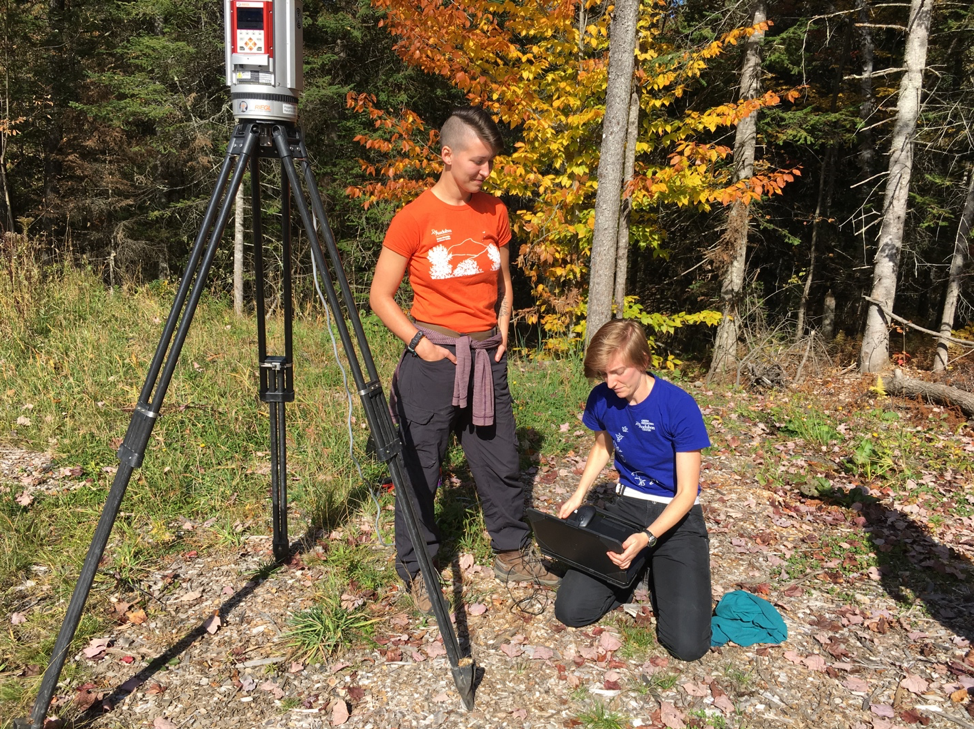
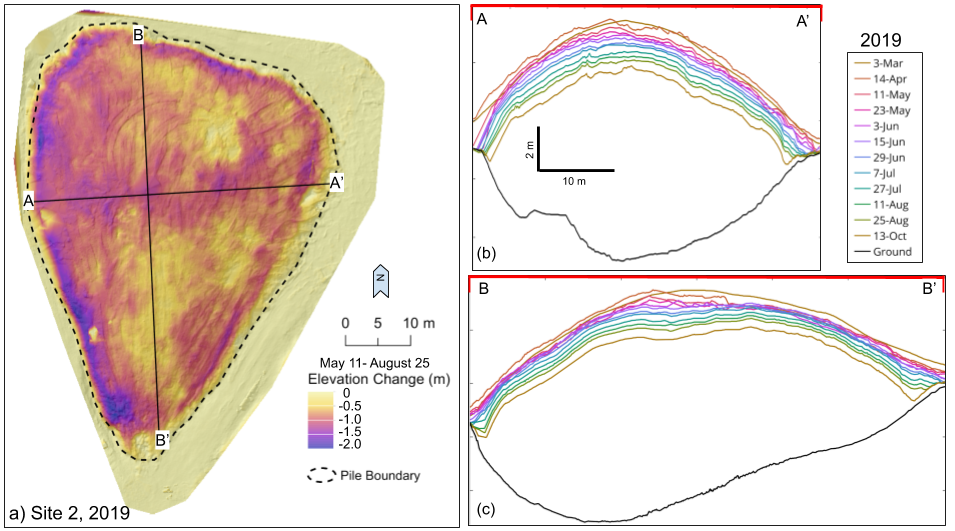
We’ve been heading up every two weeks to scan the pile and collected some pretty cool data. The cross section below snows relatively consistent loss of volume – including compaction and some melting. Scanning wasn’t bad with my indispensable field assistant, Molly Murtha, especially if we remembered to bring bug spray.
Across the Fence, a UVM news reporting group, came across my research and thought their viewers would be interested. They did a great job with the story.
Tags: Across the Fence, LiDAR, melt, scanning, snow storage, The Science of Storing Snow, volume change, YouTube
Recent Comments