
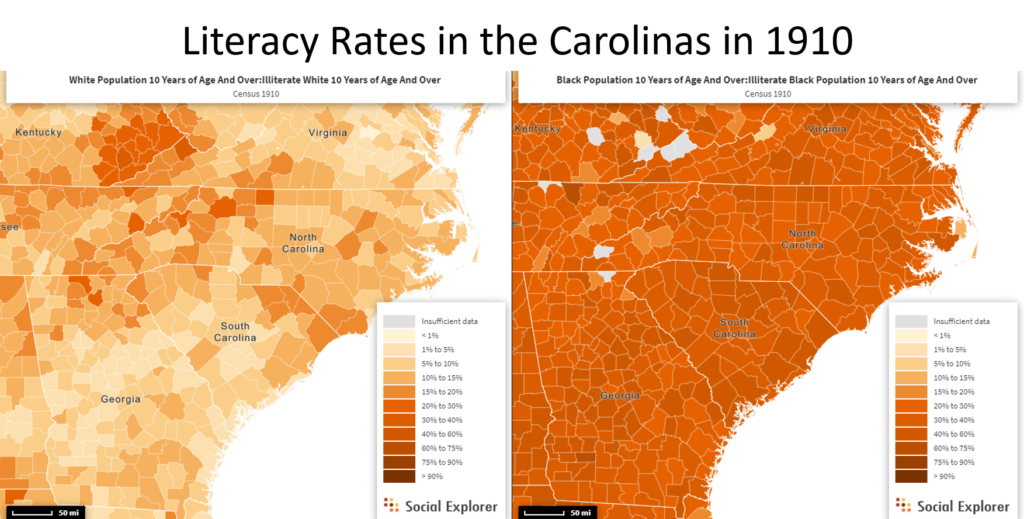
This map shows the differences in literacy rates between the white and black populations.
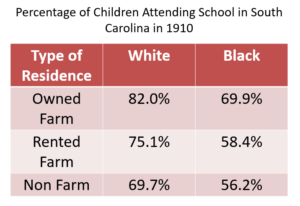
With the increase in manufacturing in this time period and the use of child labor in low skilled jobs, many children found themselves working in the production of clothes. The two main sources of employment for children in the textile industry were cotton farms and textile mills. Cotton farms were only found in the south because the north did not have the proper conditions for cotton to grow. The textile mills started out in the north but by the twentieth century they had mostly moved production to the south to take advantage of cheaper labor. In the south labor was racially segregated and only 2.8% of workers in textile mills in North Carolina and 5.6% in South Carolina were black. Most of the black labor in the south during this time was concentrated in farming during this time. This is because the partly effects of slavery left the black population in towns with high concentrations of cotton farms and not many other forms of employment and also partly because racial segregation kept blacks out of most other industries. Since farm owners during this time were afraid that a more educated workforce would cost more and textile mill owners wanted more educated workers so they could get more production from their factories. These factors cause they factory owners and farm owners to both want the funding for education to go toward white communities. This made it more difficult for blacks to get funding for schools. In South Carolina there was 1.9 black teachers for every 100 black student compared to 2.9 white teachers for every 100 white students. There was also only $2.00 of funding for each black student compared to $10.80 for each white student.(Walters 1992, p.683) The segregation of labor in the clothing industry helped push along racist policies that made it more difficult for some kids to get educated based on their race. It is easy to see the affects that these policies had on society by looking at the literacy rates and school attendance of the white and black populations.
This chart shows how the textile industry changed from 1870 to 1910. At the beginning of this time period the industry was dominated by woman (represented by the green bar) and by the end of this time period the industry was mostly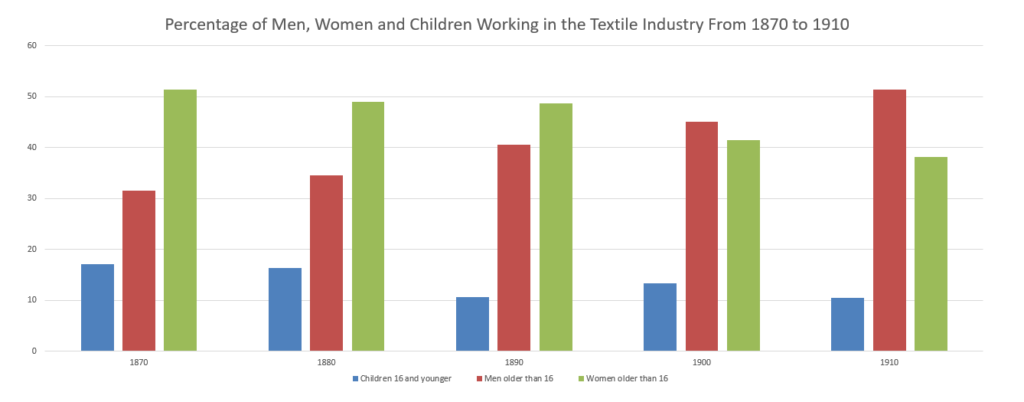 men (represented by the red bar). This chart also shows how the use of child labor (represented by the blue bar) slowly declined over this time period. The percentage of child labor declines for the first three decades then spikes up in 1900 before declining again in 1910. This can be explained by the industry investing in more factories in the south between 1890 and 1910 but by 1910 many southern states were enforcing child labor laws so the percentage of child labor went back down.
Story Map of Children’s Role in the Clothing Industry
Save
Save
Save