Maps from US Census Data
Curated by Molly Myers
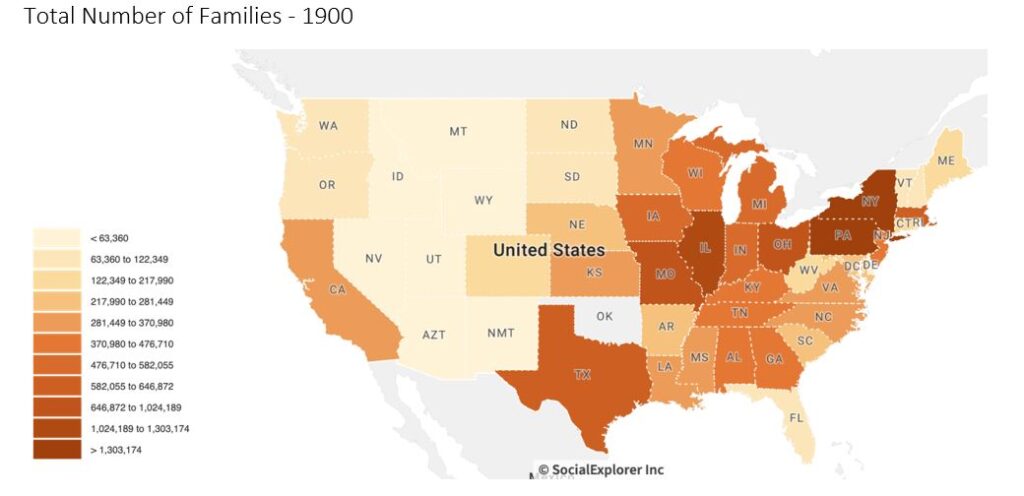
The concentration of families in the eastern part of the United States shows that these states had higher populations than their western counterparts. The southern states in particular such as Kentucky, Tennessee and Alabama had more families in 1900 than they do in 1930 (as seen below). This could be due in part to the increasing of child labor law restrictions; children were no longer economic assets as they became members of the family who added value to overall life rather than be an extra set of hands.
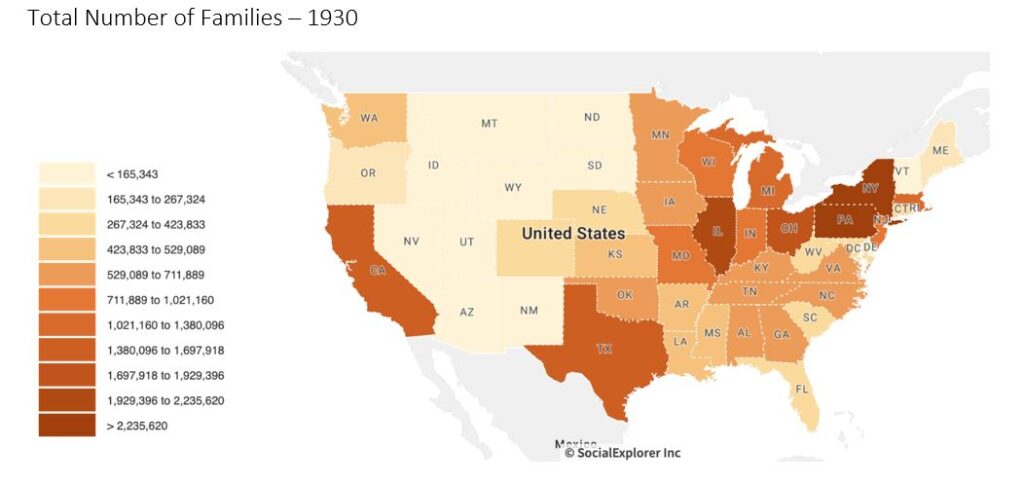
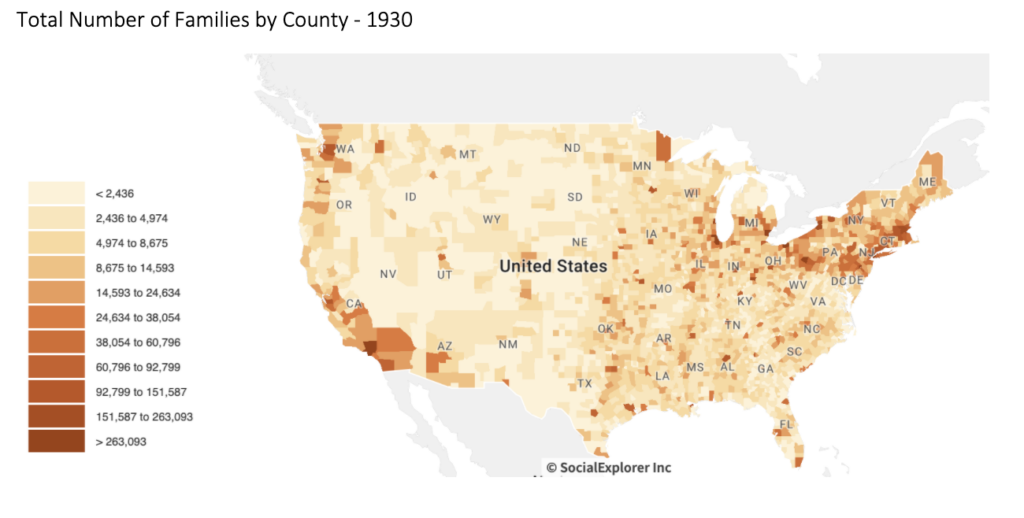
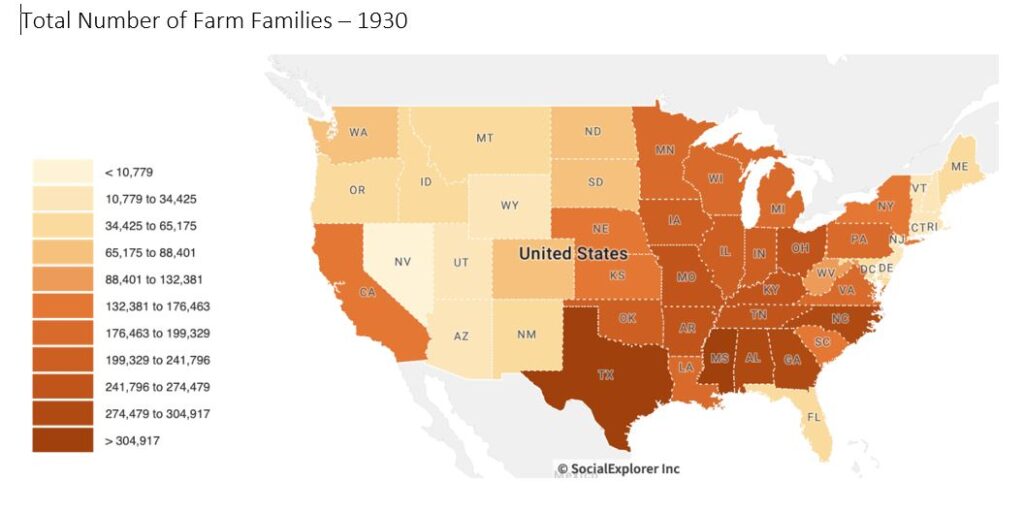
Compared to 1900, 1930 sees fewer families in the south. The concentration of the total number of families has increased in states such as California and been maintained throughout the midwest and into the north east. The western United States saw a decline in their total number of families, presumably as compulsory schooling laws went into effect and children and their families moved closer to metropolitan areas where education was available. Below, the concentration of families by county is displayed. The same trend is true where the western United States has less total families by county than the north east.
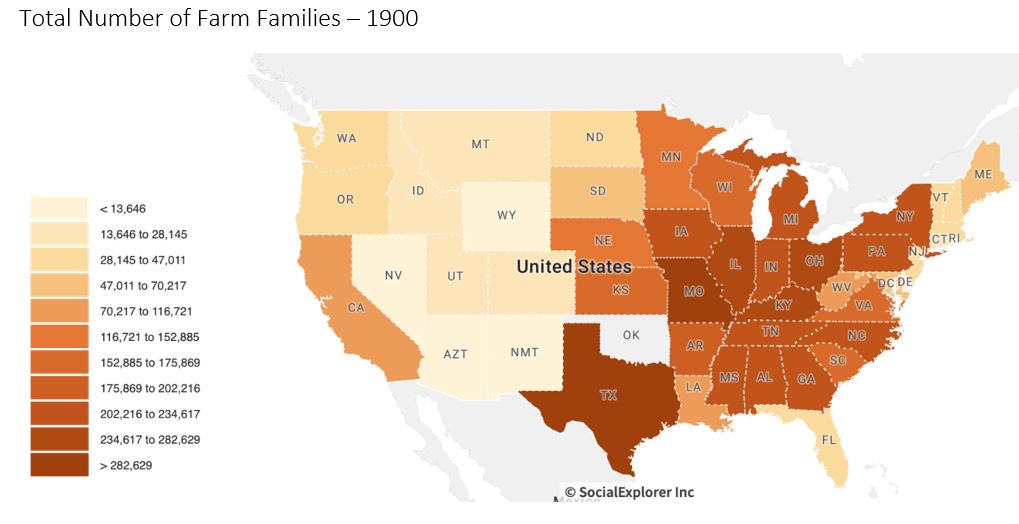
The total number of farm families stayed relatively stagnant in this thirty year period, with slight decreases in states like Missouri and Alabama.
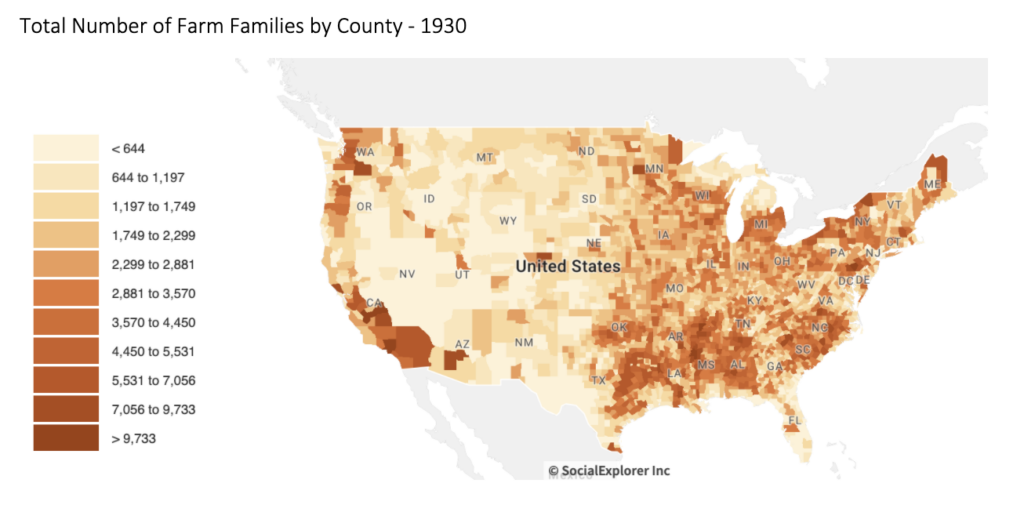
The total number of farm families by county can be seen in the above map. The concentration of families in the south is evident, despite its slight decrease from 1900.
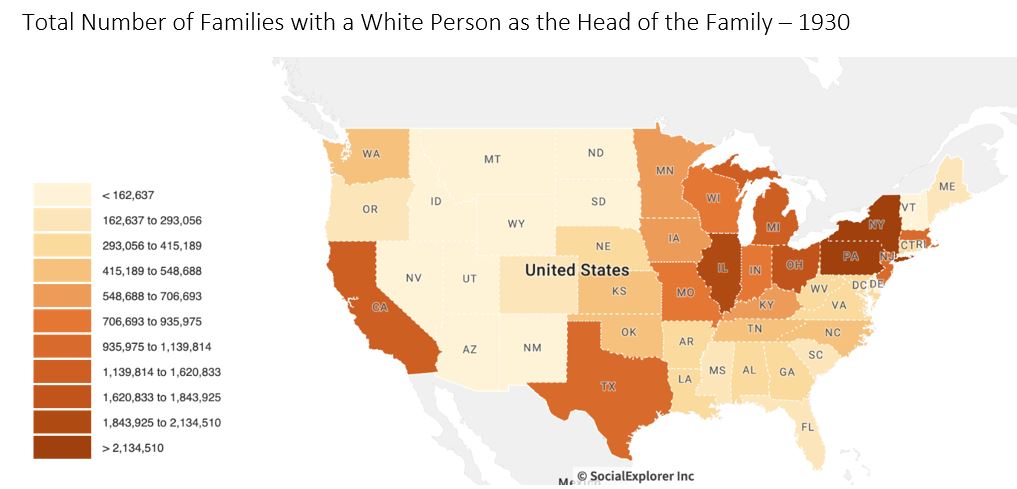
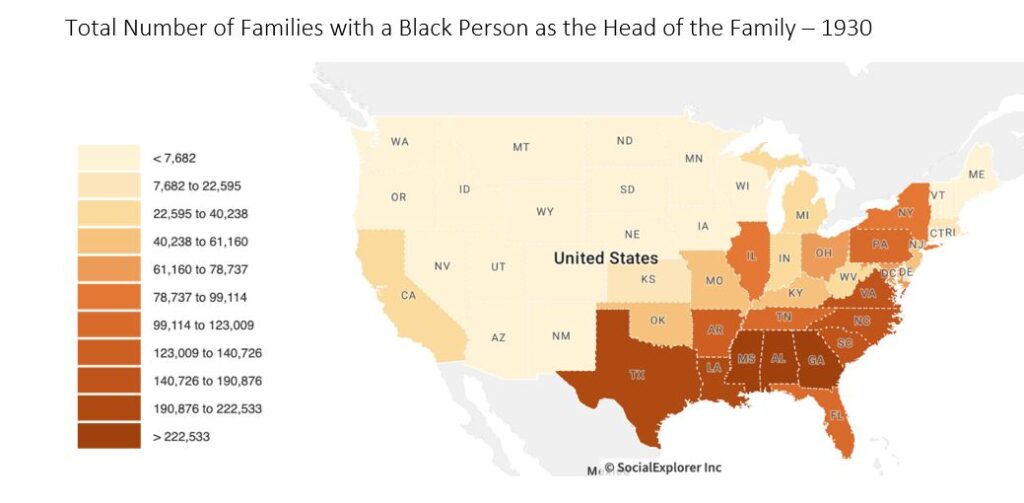
In exploring the racial dimensions of families in the historical United States, looking toward heads of the family can provide greater insight. The racial difference between the north and south follows expected trends, with the north having far more white people as designated head of the family than the south. States like New York and Pennsylvania reported the highest number of families with a white person as the head. Southern states like Mississippi, Alabama and Georgia had the most families with a black person as the reported head of the family.