Map of the United States’ School Districts by the Federal NCES Locale Codes, 2006
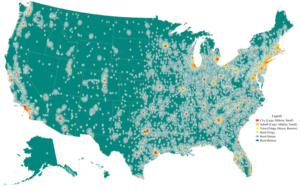
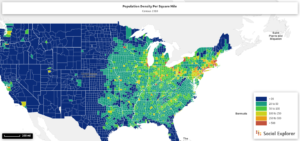
These two maps show population trends throughout the country, the first in 1910 and the second in 2006, more than one hundred years later. Some obvious similarities are the many population centers along the east coast and around the Great Lakes, which remain urban centers. Also important to notice is the stark divide that occurs once the great plains are reached. In the 1910 map there are only a handful of counties with more than 20 people per square mile, and in most cases those areas are still largely rural, with still a handful of larger cities few and far between.
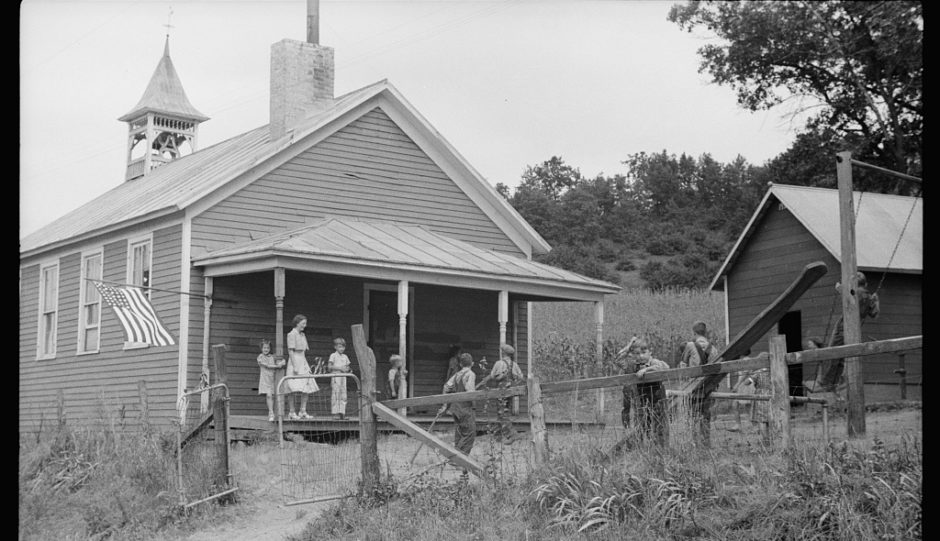
While it may appear on the macro-scale that little has changed among the rural and urban divisions in the United States, the shape that schooling in these places underwent a radical shift in the early 20th century. Below are two graphs that show the downward trend in one-teacher public schools starting in 1916. These small rural schools were steadily replaced by larger schools who could accommodate more students, and use of new methods of transportation like the Kid-hack could bring children from further away to more centralized schools. By 1950 the iconic one room school houses had been reduced to nearly a fourth in number.
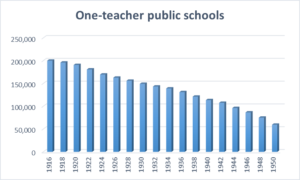
| School Year ending | One-teacher public schools |
| 1916 | 200,100 |
| 1918 | 196,000 |
| 1920 | 190,700 |
| 1922 | 180,800 |
| 1924 | 169,700 |
| 1926 | 162,800 |
| 1928 | 156,100 |
| 1930 | 149,282 |
| 1932 | 143,391 |
| 1934 | 139,166 |
| 1936 | 131,101 |
| 1938 | 121,178 |
| 1940 | 113,600 |
| 1942 | 107,692 |
| 1944 | 96,302 |
| 1946 | 86,563 |
| 1948 | 75,096 |
| 1950 | 59,652 |