Introduction:
A scientist in his laboratory is not a mere technician: he is also a child confronting natural phenomena that impress him as though they were fairy tales.
~Marie Curie
Wherein the right-brained dendrochronologist flourishes in their field work, those of a more logical orientation thrive in the lab. It is the task of the lab worker to act as detective, sleuthing out the interconnections hidden in the rings. Through cogent reasoning, each small ring, scar, and aberration is attributed to a story: a history of the trials and tribulations of the tree– its joyous and trattorias years– is awaiting discovery. The lab worker, by numerous hours devoted to the duty, interprets the language of the tree and makes vocal the most silent members of our forest community.
Materials:
 Mounting Block: This is a long, rectangular block with a divot on the uppermost side. The core is glued into the block, taped down, and dried for a period of time.
Sandpaper: A variety of rough-to-fine grit sandpaper is used to smooth the cores in order to bring the ring structure into greater visibility.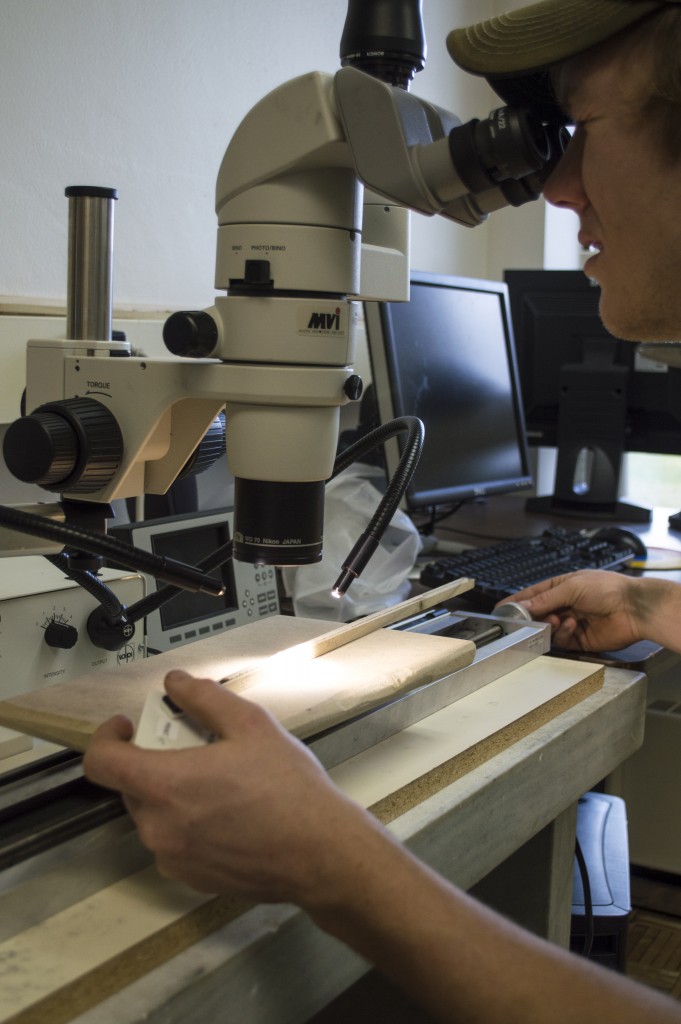
Microscope: A Nikon microscope–with measurement accuracy down to 0.001mm–allows for further analysis of ring structure. From this close-up look, false rings, micro-rings, and a variety of other anomalies may be corrected for.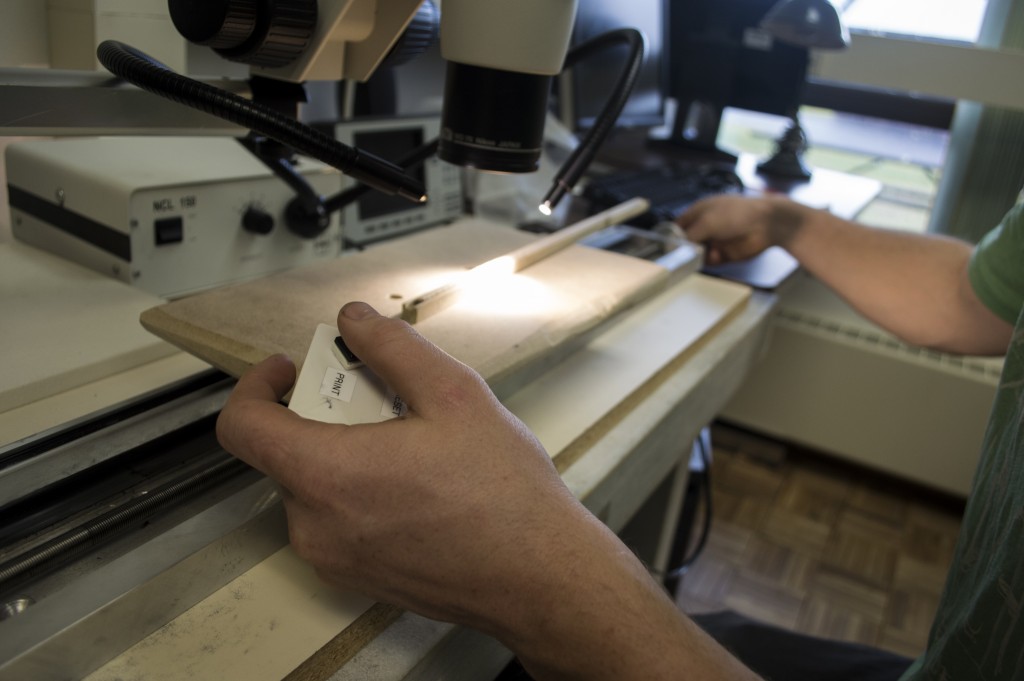
Sliding Scale Micrometer: This specialized platform moves by way of a turn wheel at its far end. With each turn, length is reported to an apparatus which records the width of each ring, designated by the push of a button.
J2X: This computer program records the data collected from the sliding scale micrometer.
COFECHA: A more complex software program, COFECHA is used to, “check the cross-dating and overall quality of tree-ring chronologies” (Grissino-Mayer, 2005).
Process:
- First, prepare cores. Once the cores have been collected from the field, slits are made in the straws using a razor. This would allow air in and moisture out of the cores before there placed in an oven.
- Put cores into oven. The cores are dried in an oven.
- Glue down cores. Cores are glued into wooden slotted mounts using the world’s finest Elmer’s water soluble glue.
- Orient the cores right side up. It is very important that the cores are oriented so that the tracheid cells can be seen from above, this makes counting rings easier.
- Tape down cores to wooden mounts. The cores and mounts are taped so the cores would dry flat.
- Separate each core from wooden mounts. Once the glue is dried and set, wooden mounts holding each core are separated using a small saw so that the cores can be easily compared.
- Remove tape. Tape is carefully removed from individual cores for sanding. Make sure rings are clearly visible and that no cores are twisted.
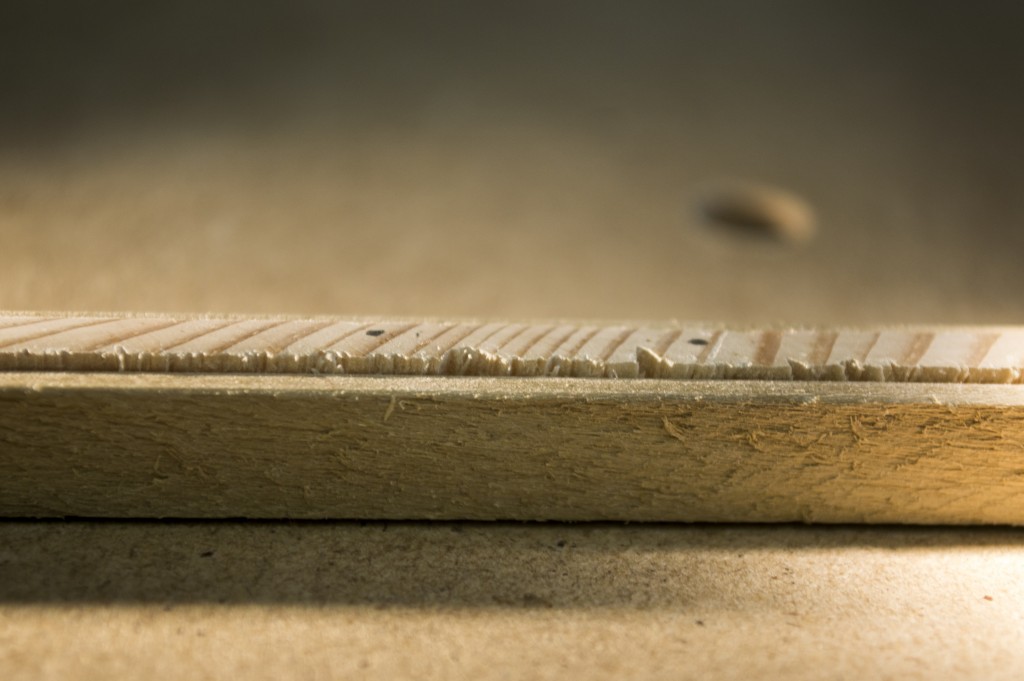
- Sand cores. Working from a higher grit to finer grit sandpaper, cores should be sanded until individual rings are visible.
- Count rings. Counting is done by starting at the first visible ring closest to the bark and counting inward toward the pith in groups of ten.
- Mark every ten years. Each tenth ring was marked by a single dot using the world’s most ordinary mechanical pencil. The fifth group of rings was marked by two vertical dots representing fifty rings. Dots are made directly onto the core itself and the total number of rings was noted.
List Method: The list method is the process of crossdating by listing every thin ring within each core and correlating the years that are present within each ring.
- Each core is labeled on a piece of paper.
- Underneath name of core, create a list of each narrow ring’s age.
- Compare each core’s narrow years to the next, if any years match, circle them for easy identification.
- See if there is any climate data to reveal a specific weather event that might have effected the tree’s growth.
Skeleton Plotting:
- Use graph paper. Each core should have its own piece of graph paper. Skeleton plots were created using the vertical line technique on 120-year extraordinarily conventional graph paper.
- Make corresponding lines for each narrow ring. On the graph paper vertical lines represented relative width of individual rings. Ring width size was dependent on a comparison of two neighboring rings on either side. The smaller the ring width, the longer the line was on the skeleton plot.
- Comparing rings to make into a composite plot. Once a skeleton plot is created for each core from the same tree, they are combined into a composite skeleton plot. This is done by lining up similar narrow ring patterns of both cores and plotting the lines that matched up onto a new piece of graph paper.
- Connect each narrow ring with calendar date. Calendar dates were assigned to each core by counting backwards from when the core was bored; it was 2015 for this study.
References:
Henri D. Grissino-Mayer. (2001). Evaluating Crossdating Accuracy: A Manual and Tutorial for the Computer Program COFECHA. Tree-Ring Research. Retrieved from http://arizona.openrepository.com/arizona/handle/10150/251654