Q: (Page 5, item 6 – Point Density 2: Annual kWh – b.) I am not sure about my work flow to reach an answer to this question, especially using a CON expression in the raster calculator. So I am looking for feedback / advice about whether I am doing this correctly. To answer this question I tried the following:
Step #1 – Raster Calculator with the following Math Algebra expression: Con((“PointDens_AnnualkWh_step1”) & (“PerTreeCanopy_step2” > 85), 0, (“PointDens_AnnualkWh_step1”) creating a new raster called PointDens_AnnualkWh_step2
Step #2 – Zonal Statistics as Table to sum of values for each town in PointDens_AnnualkWh_step2 (those cells assigned a value of 0 in this raster and representing cells not good for solar production essentially being excluded from the sums).
Step #3 – open Zonal Statistics table and compare sums for each town.
Is this a proper work flow to answer this question? And is the CON expression I used in raster calculator correct? Feedback would be helpful demonstrating and explaining the various ways this question could be answered (as well as the different expressions that can be used in the raster calculator in general). Would welcome thoughts from anybody.
A1 from Student: I used a different method to answer that question- I used the Con tool to replace the raster with either 0 or the existing values. Then I did the same thing you did Zonal Statistics.
A2 from instructor: You do not need to include the PointDens_AnnualkWh_step1 factor in your Con expression. I’m not sure that it would hurt, but it definitely won’t help (at a minimum it will take longer to complete this analysis than it would if there were a single factor in the expression to be evaluated). The reason I suggest it might not hurt is that you’re telling ArcGIS to look for all cells where there is a value (i.e. not Null) in the PointDens_AnnualkWh_step1 raster where the PerTreeCanopy_step2 is greater than 85%. Summarizing the result with Zonal Statistics as Table would be my preferred next step.
Alternatively, you could use the Reclassify tool and set all values in PerTreeCanopy_step2 greater than 85 to 0 and all value less than 85 to 1. Then, multiply that result by PointDens_AnnualkWh_step1. The result of that should be the same as what you’d derive with the Con expression (because everywhere the tree canopy exceeds 85% is assigned an annual kWh value of 0. Then, once again, use the Zonal Statistics as Table tool to complete the analysis.
Q on Project Raster operation: On page 2, #3(d) projecting the 2016 Percent Tree Canopy Cover to Match MRVTowns. Cell size of the raster is 30. When doing the Project Raster operation, should this be changed to match the DEM that has a cell size of 10? As a general matter, should all rasters in a given project always have the same cell size? My guess is yes, but I wanted to ask before I get too far into the lab.
A: You do not need to change the cell size of the tree canopy data. The rasters do not need to be the same size. I do like to ensure they use the same Coordinate System and Snap Raster to ensure that you have control over any resampling that occurs when transforming your data via geoprocessing.
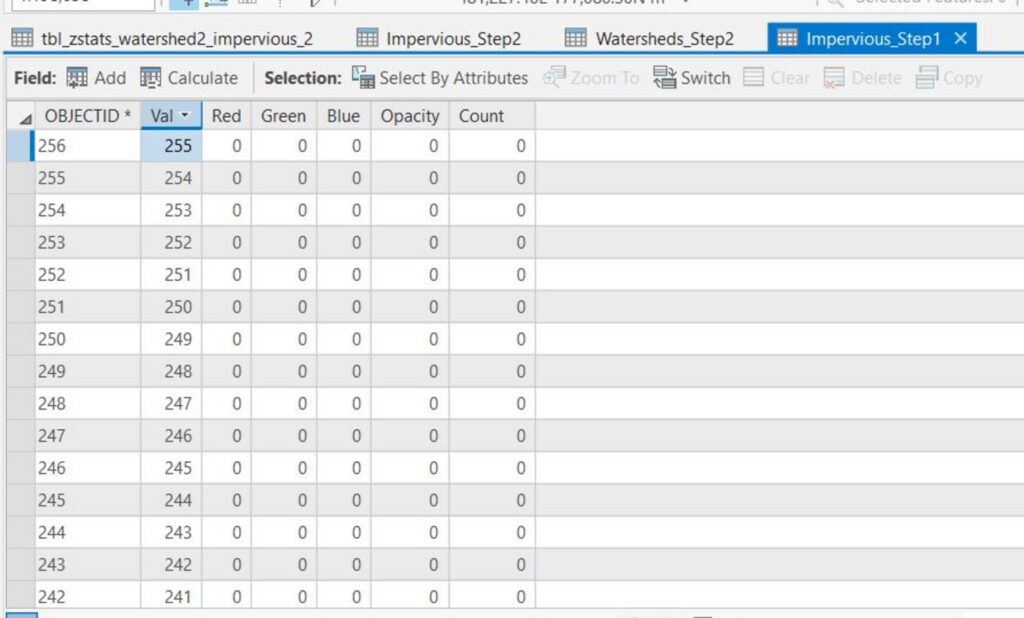
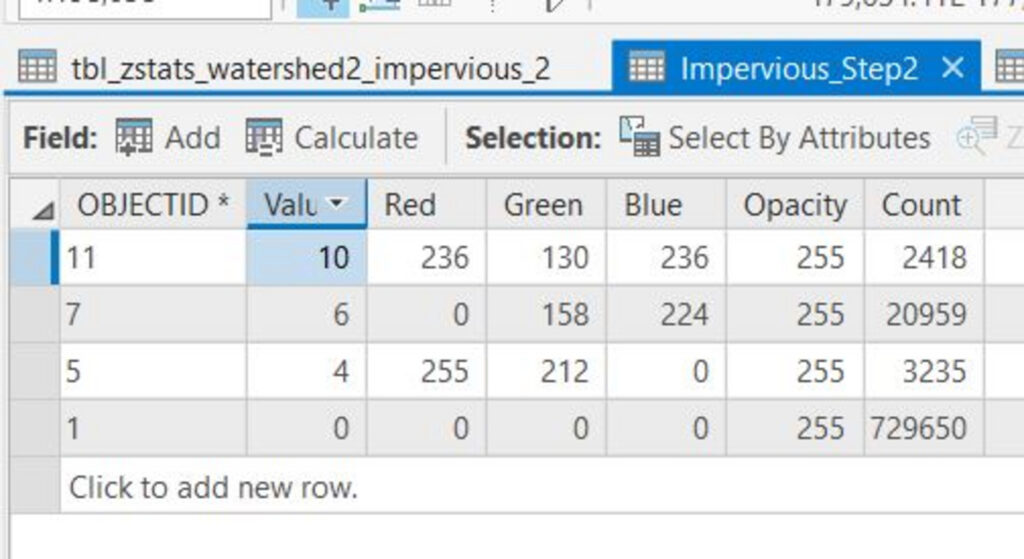
Q on Percent Impervious: I’m creating my map layout, and I’m realizing my percent impervious may be off. I’ve gone back to see if there were mistakes in clipping or zonal stats, but I can’t seem to find the error. My percent impervious ranges from ~2% upwards of 300. Any ideas? I’m attaching the zonal stats as table and the attribute table for impervious here. I’m also attaching the attribute table before I clipped the data. Here are the tables in descending order.


A: Only thing I can think of here is that you computed the zonal stats on the wrong attribute. Confirm you used Zonal Statistics As Table and that the impervious raster was set as the Input Value Raster?
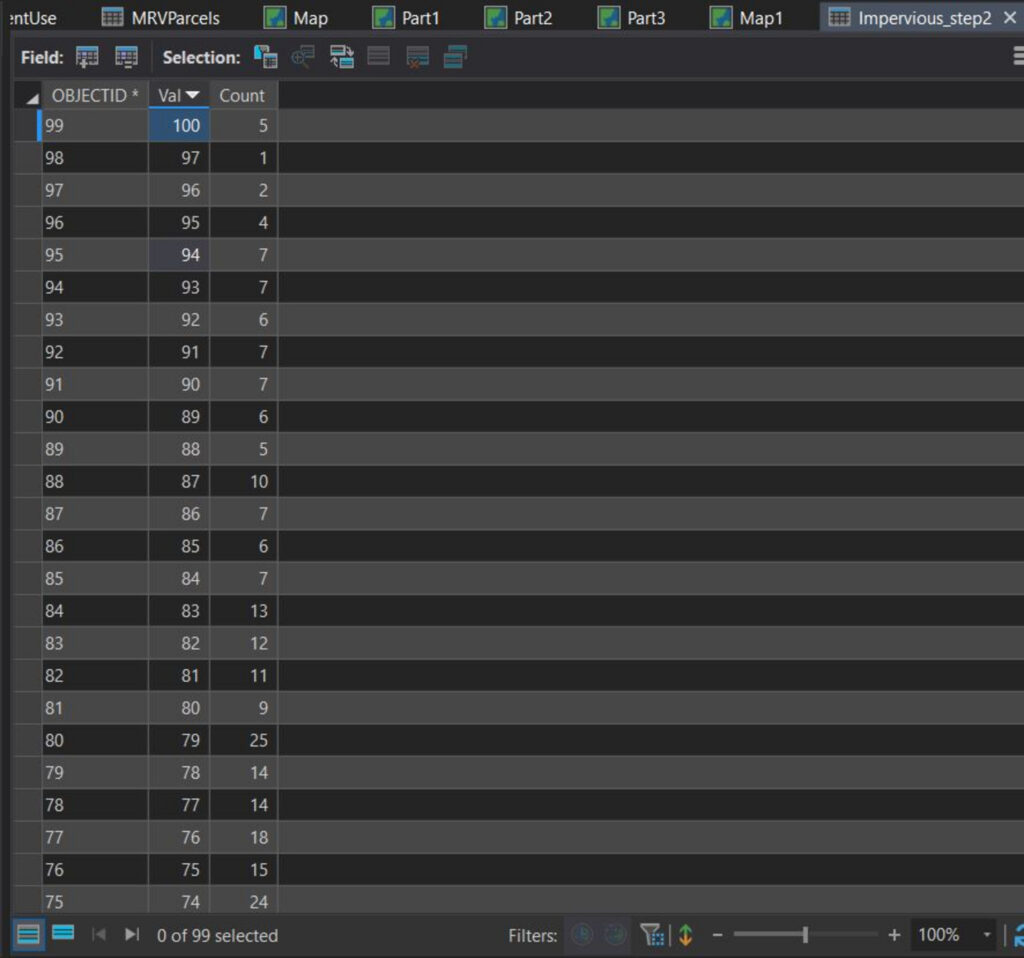
It appears you have something joined to the Watershed_step2 dataset. This could certainly have an impact on the output if you’re naming the output the same as the table that’s already joined to one of the inputs. Try removing all joins from Watershed_step2 and then run Zonal Statistics As Table again. I’m also a little confused by your Impervious_step2 Attribute Table. Are there really only 4 records? There should be 99. The Value attribute should include at least one pixel for all values 0 – 97 & 100. Here’s a screenshot from my Lab 4 Project.
