May 1st, 2025

Final visit to Casavant!

While Casavant was not my phenology site in the fall/early winter, I have definitely watched it change through the seasons. The transition from winter to spring is a beautiful phenomenon and there is no other place I’d have chosen to observe it in real time.
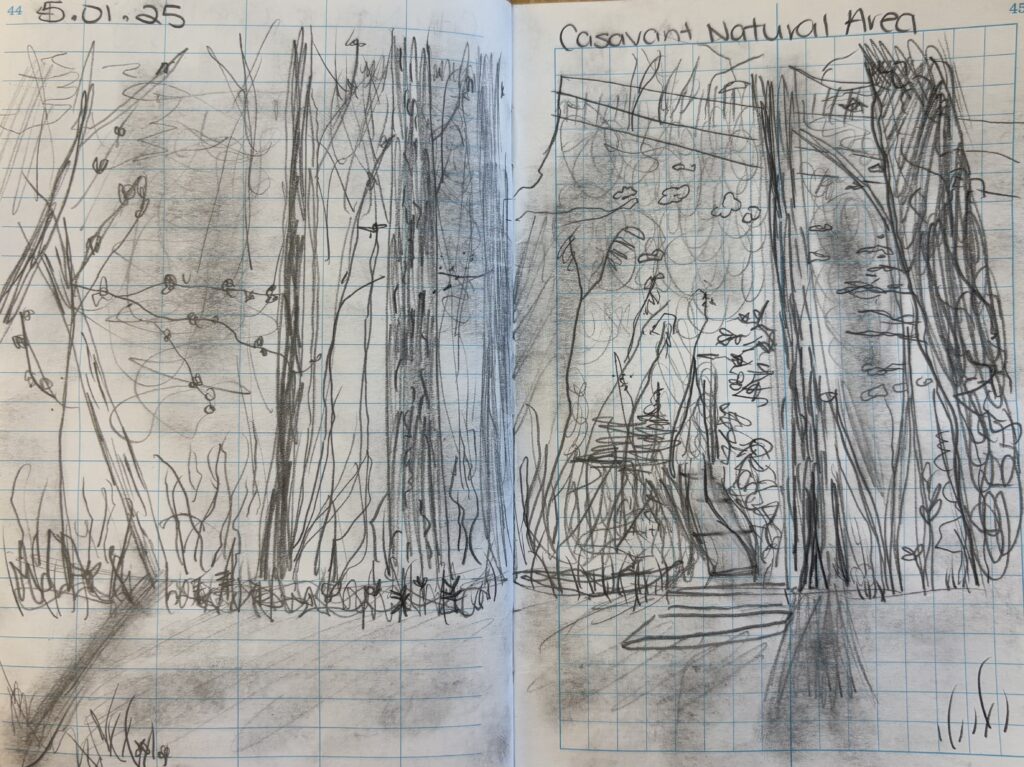
Sit & Sketch

my reference 🙂

Changing Seasons

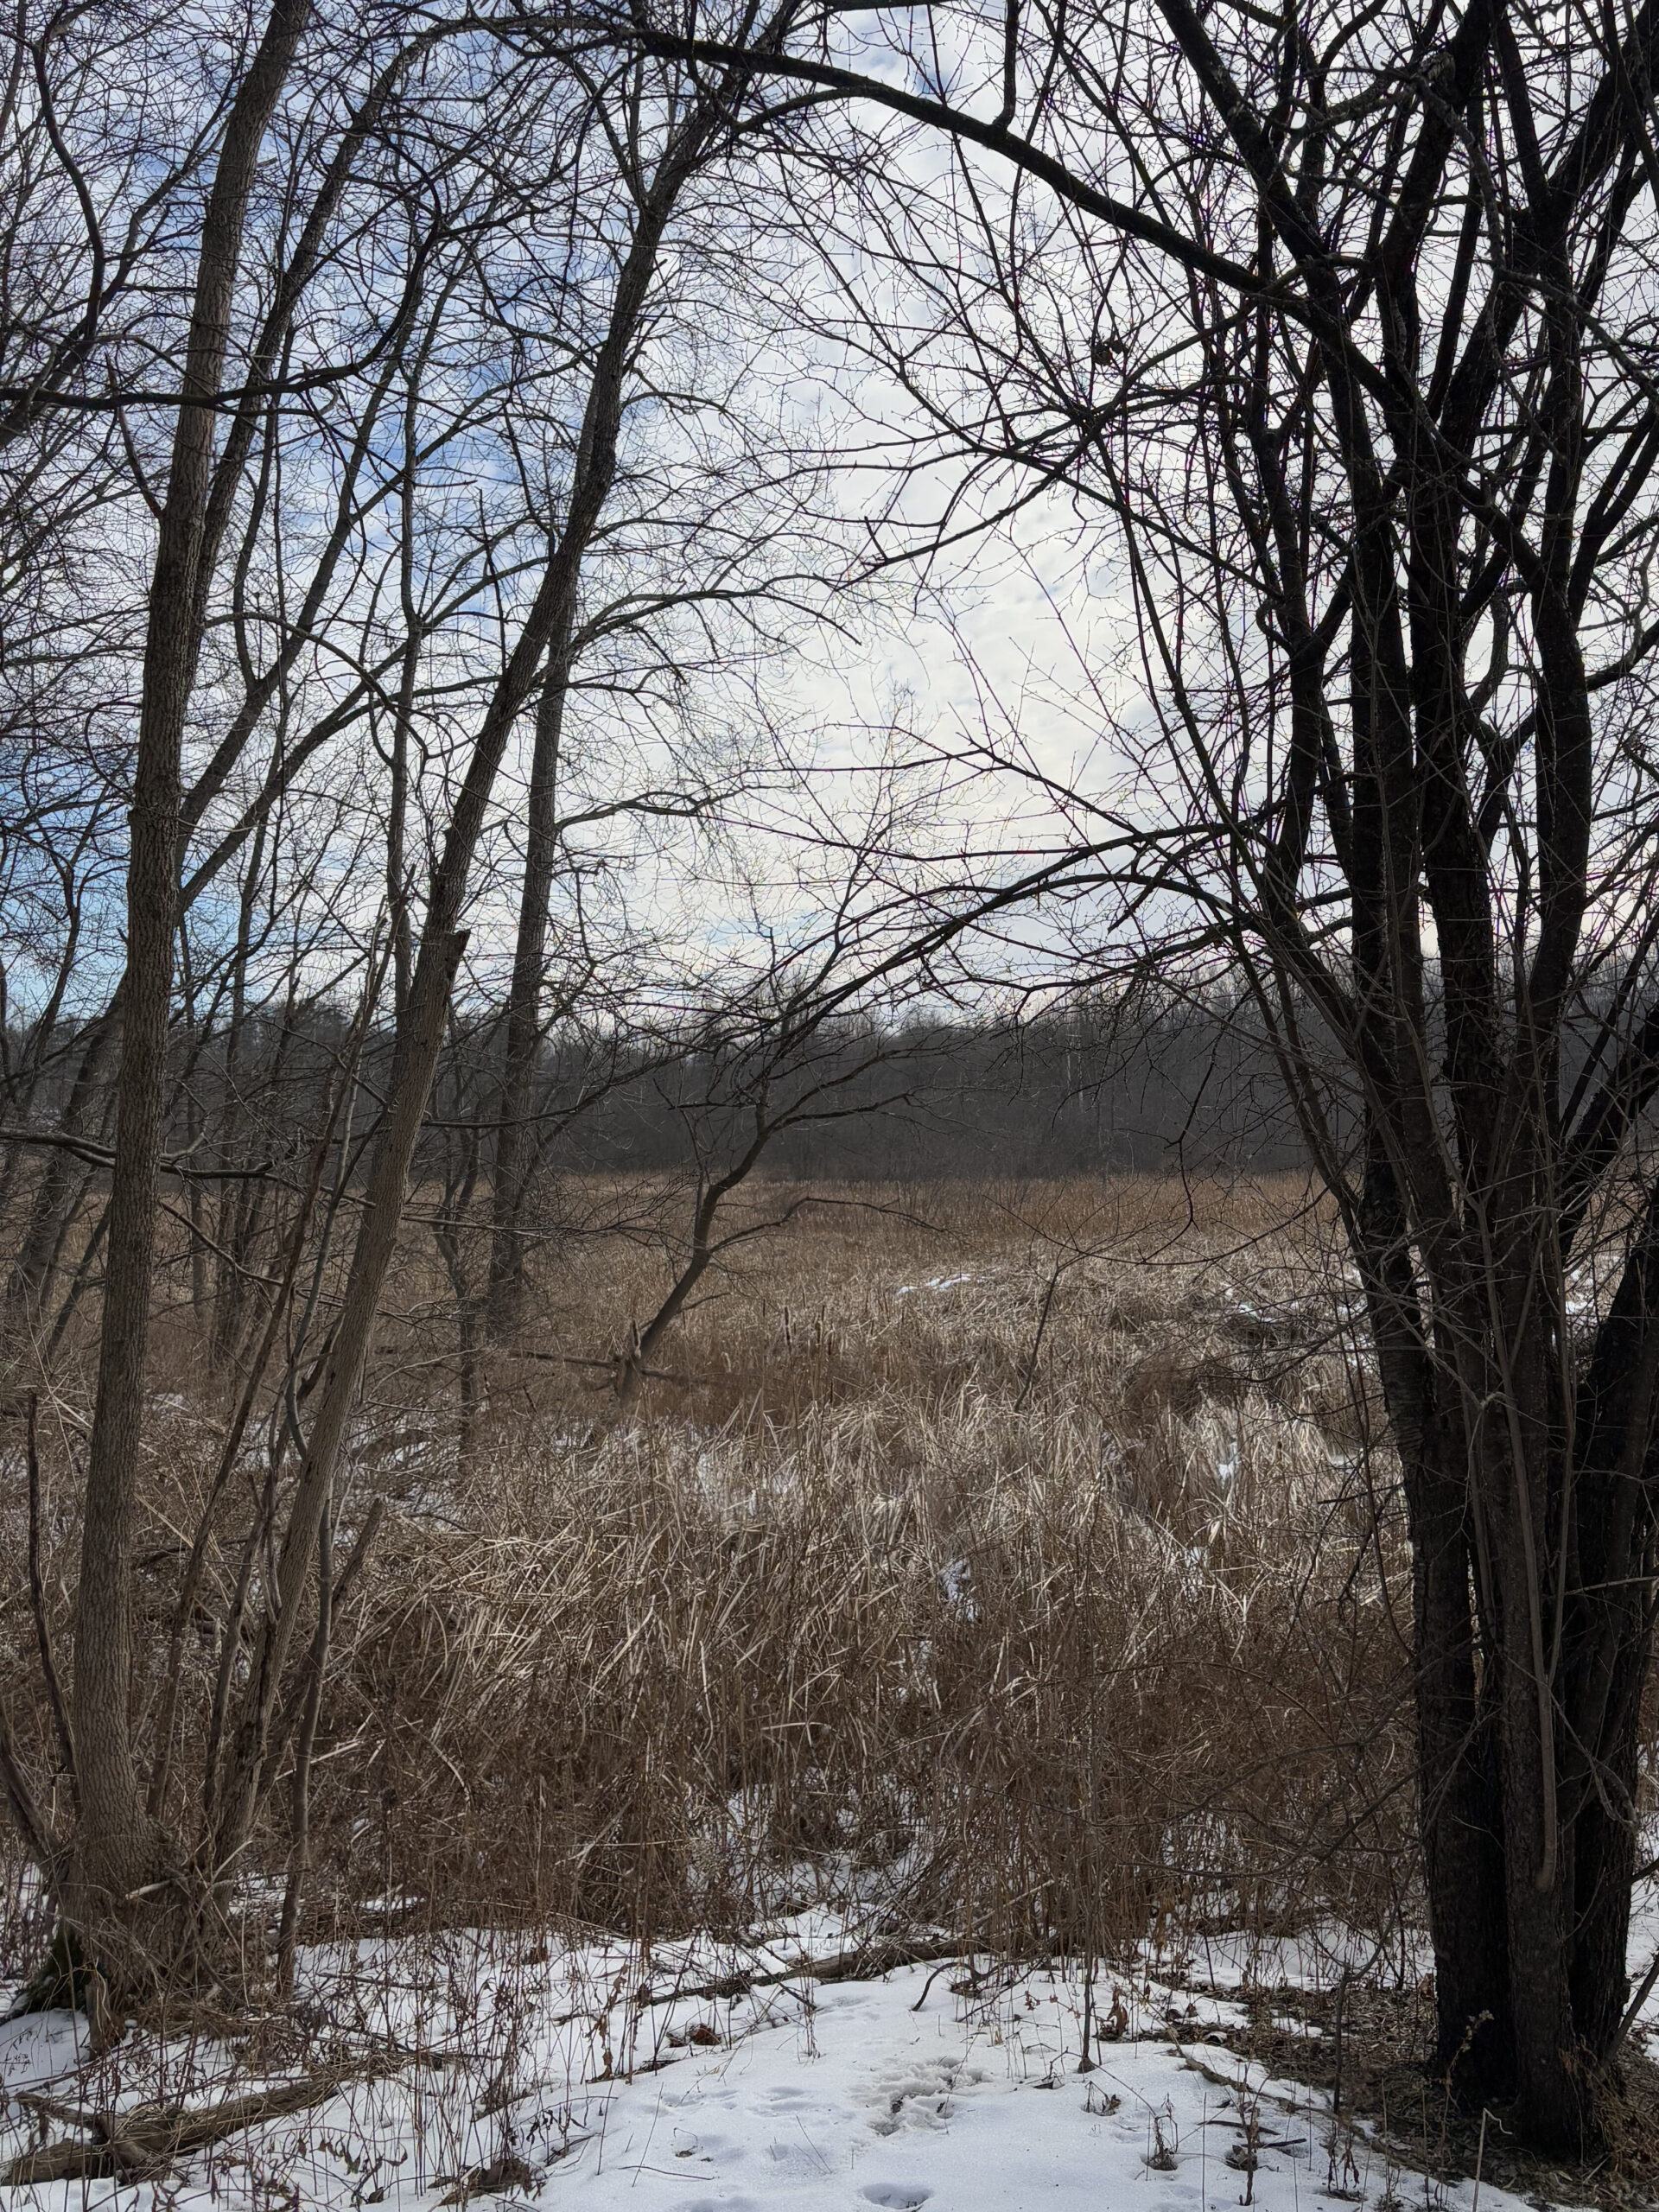
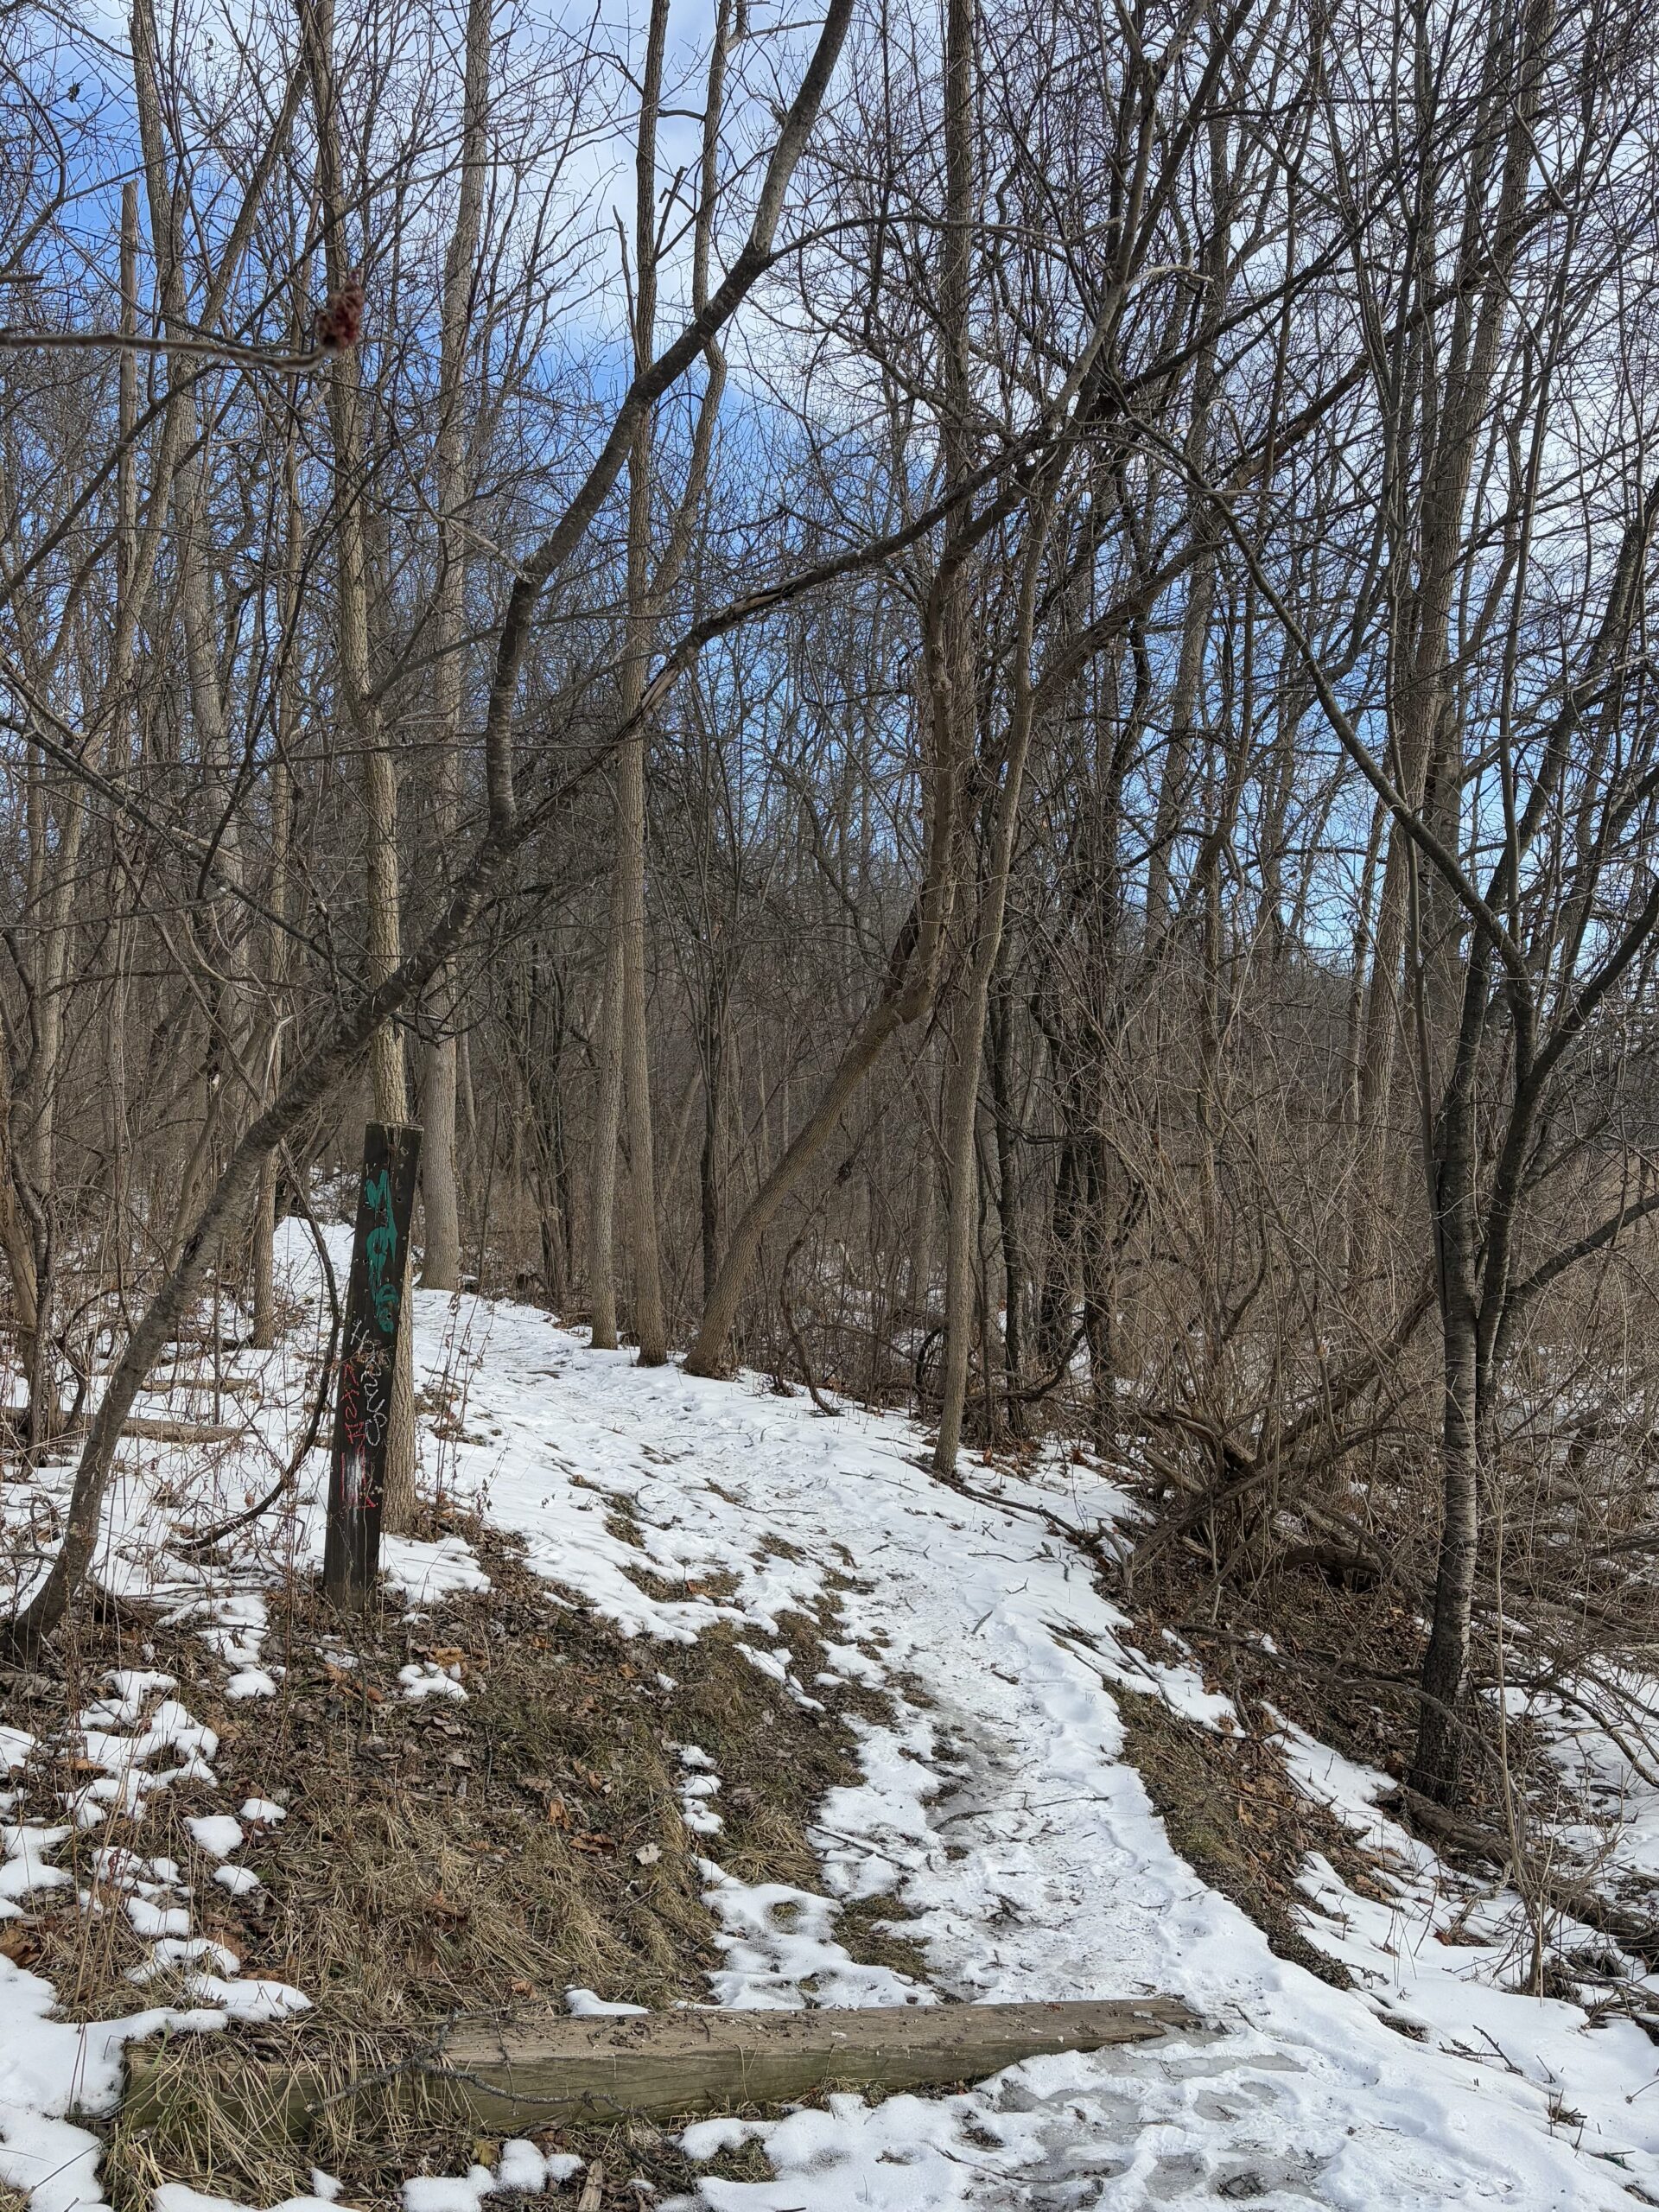
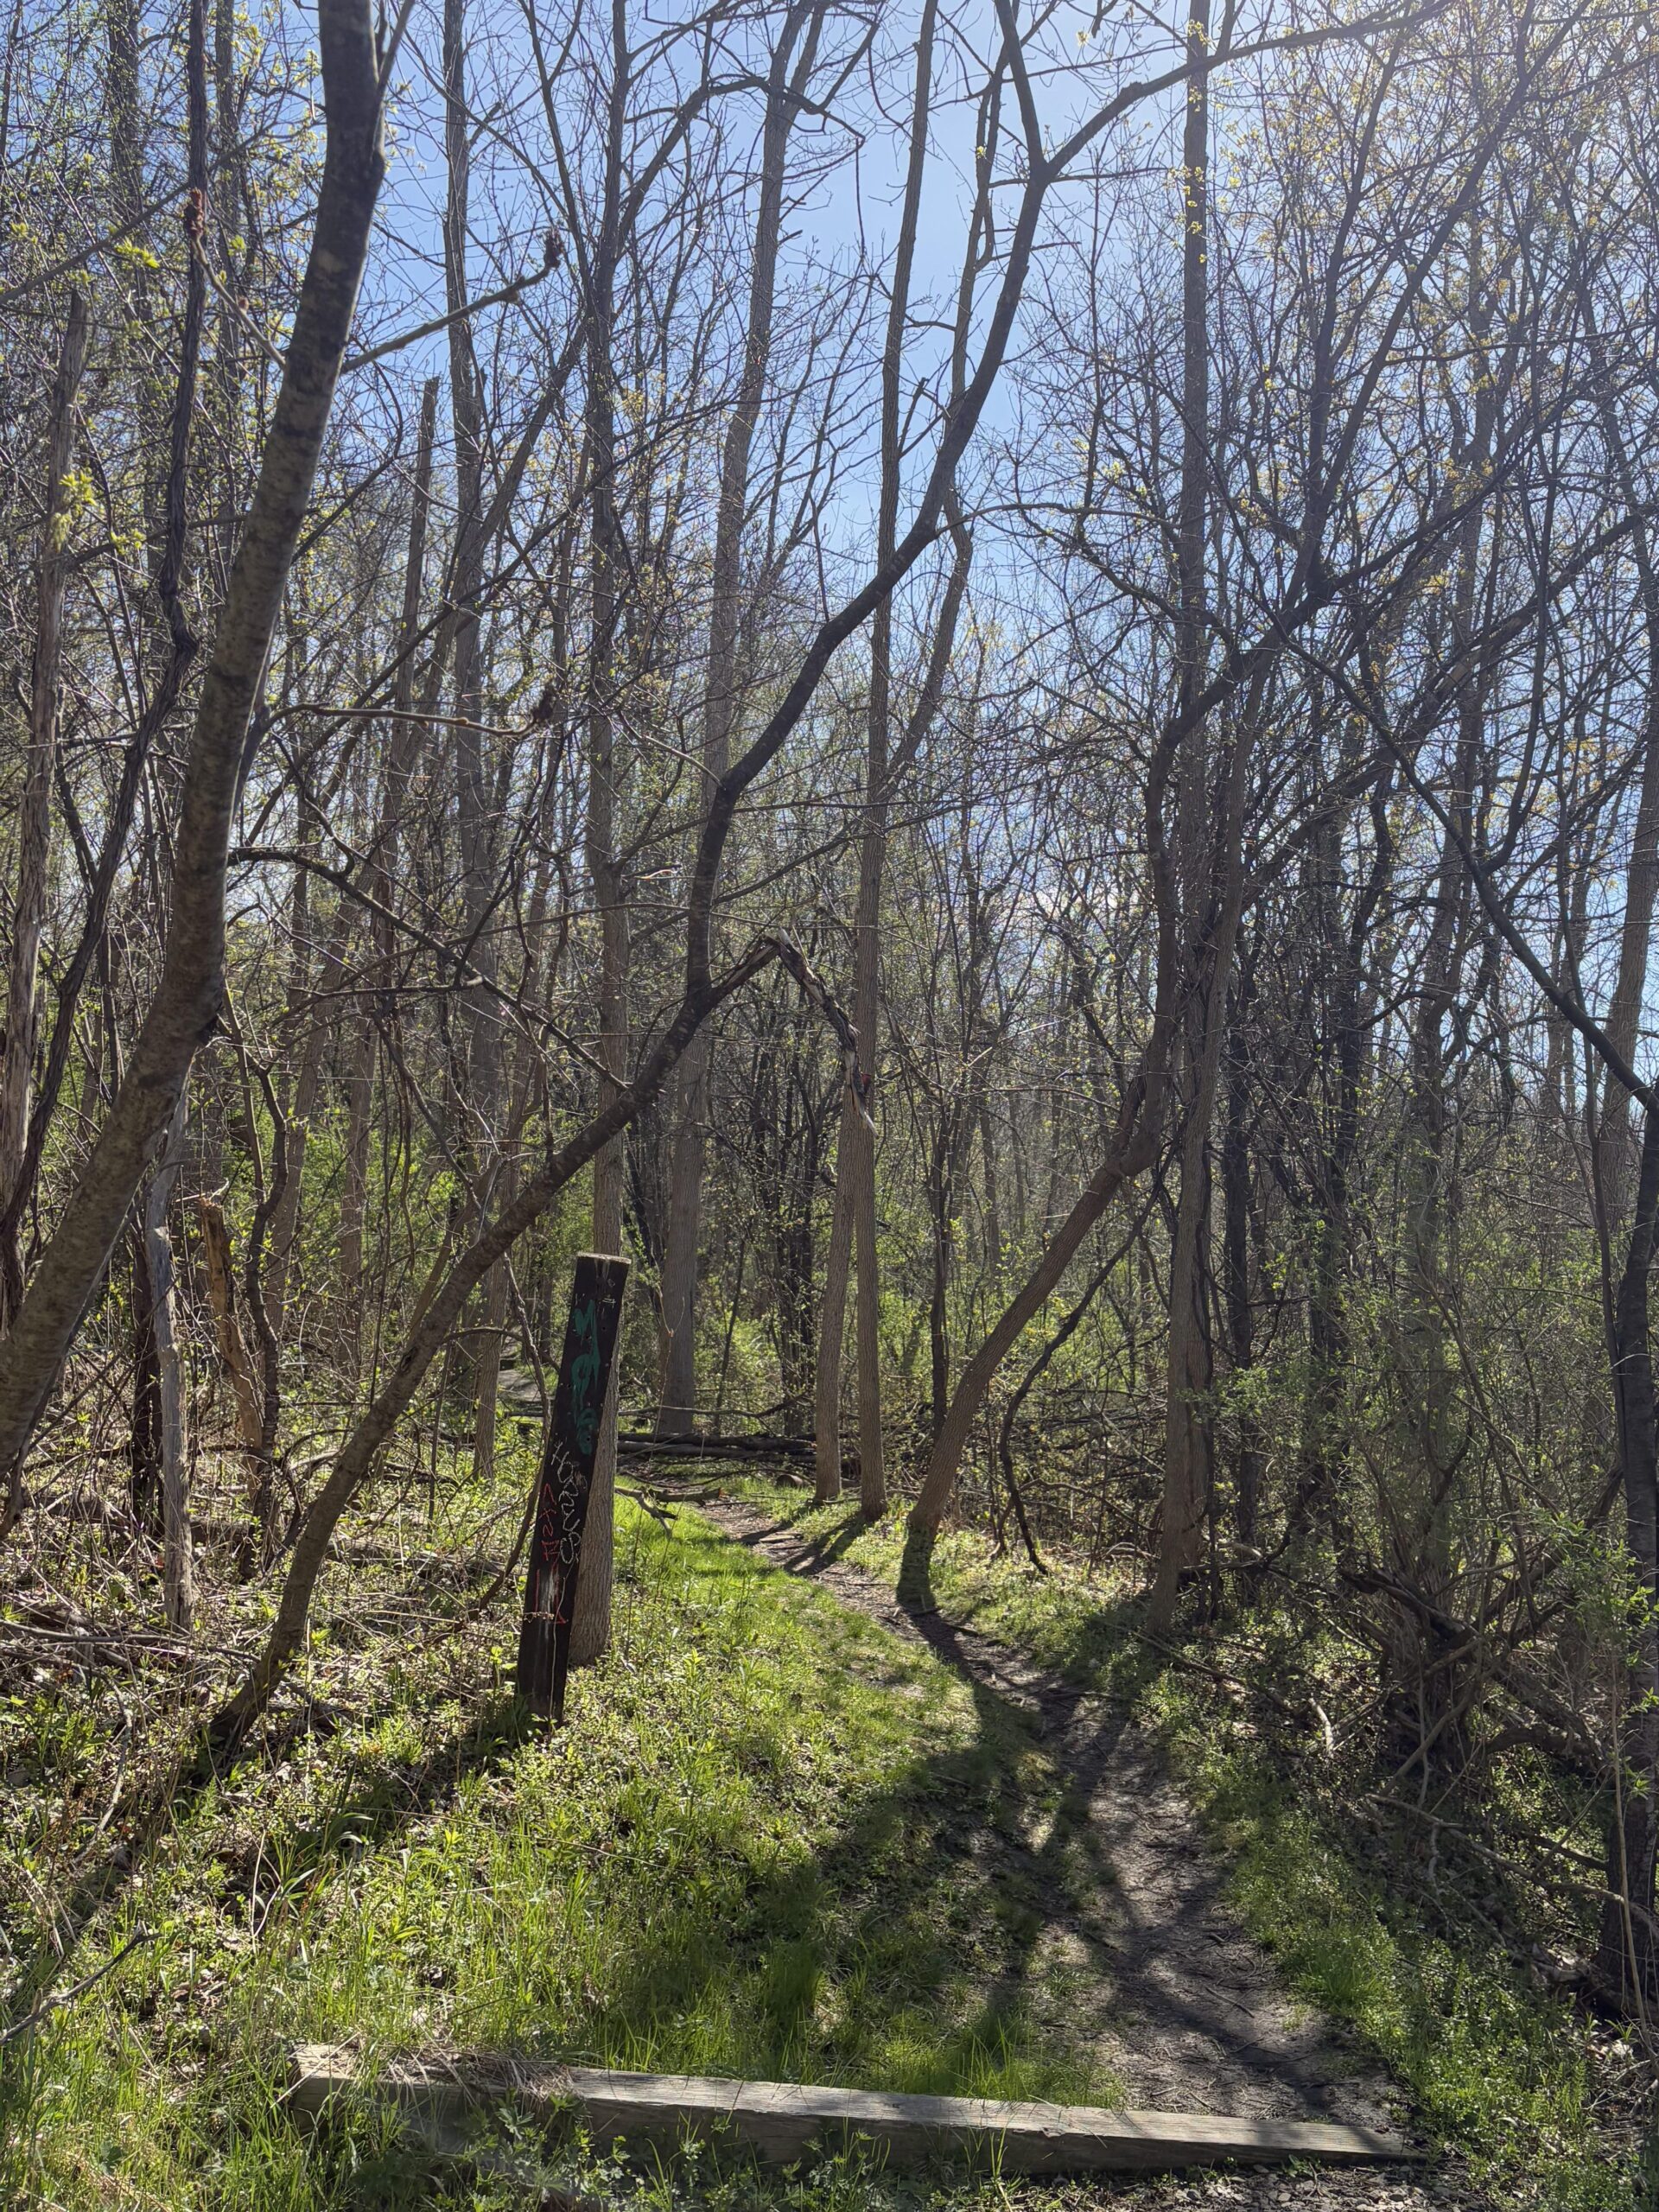
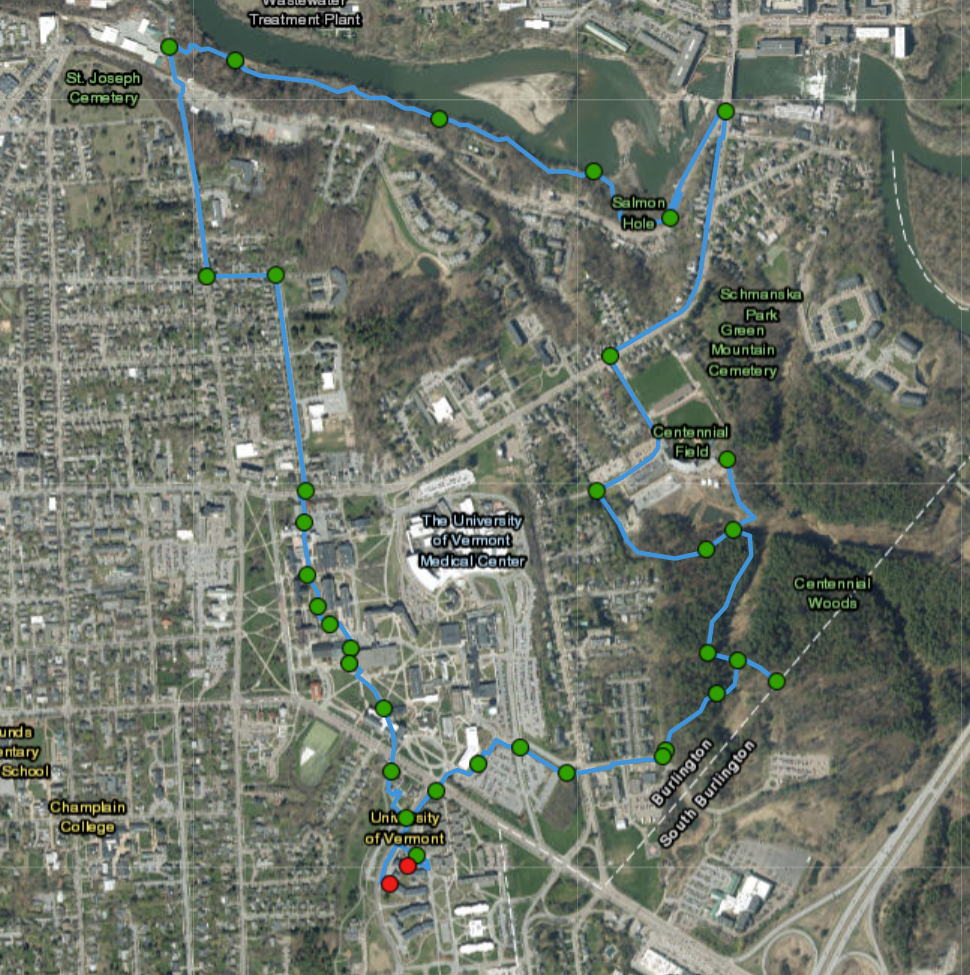
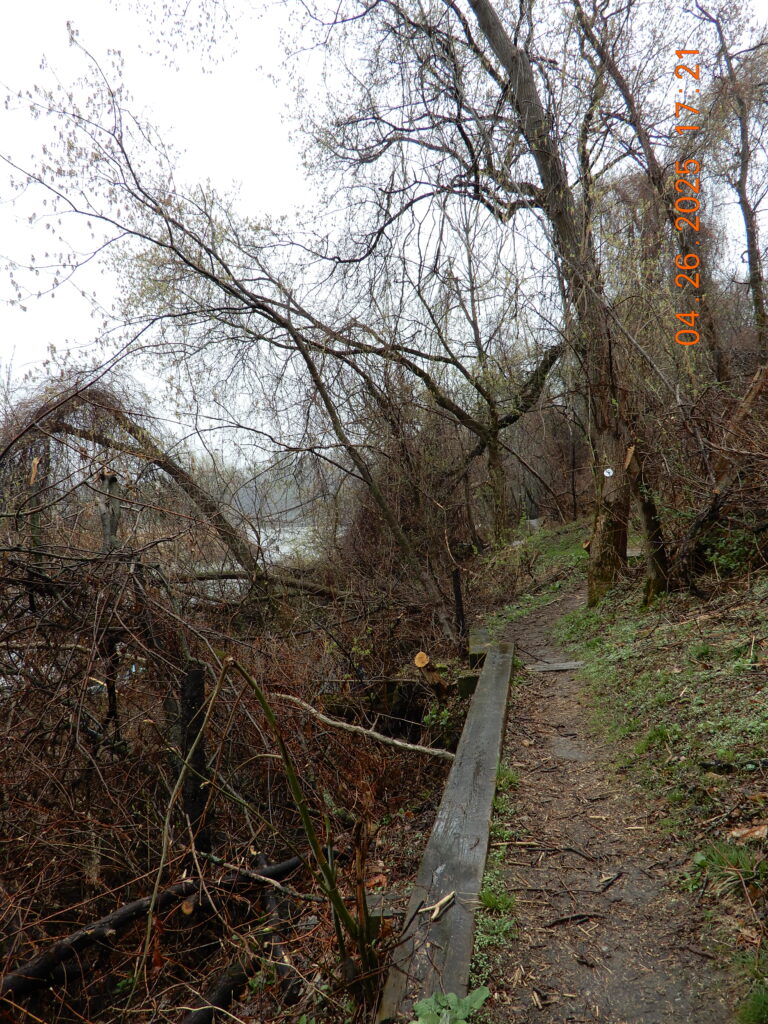
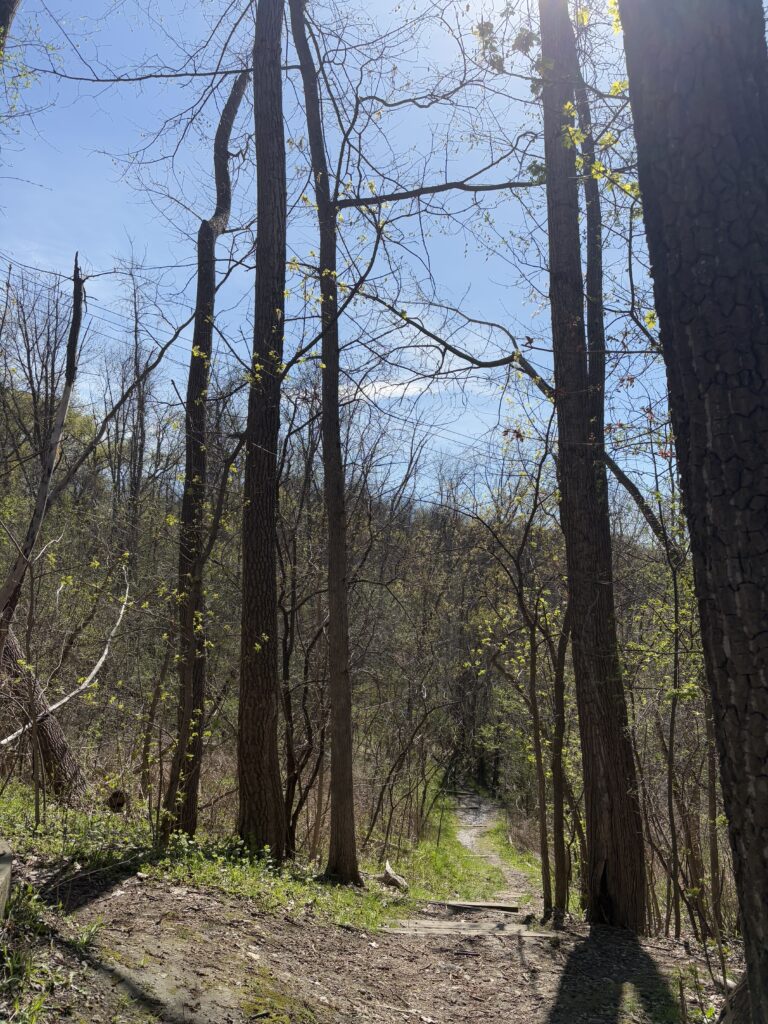
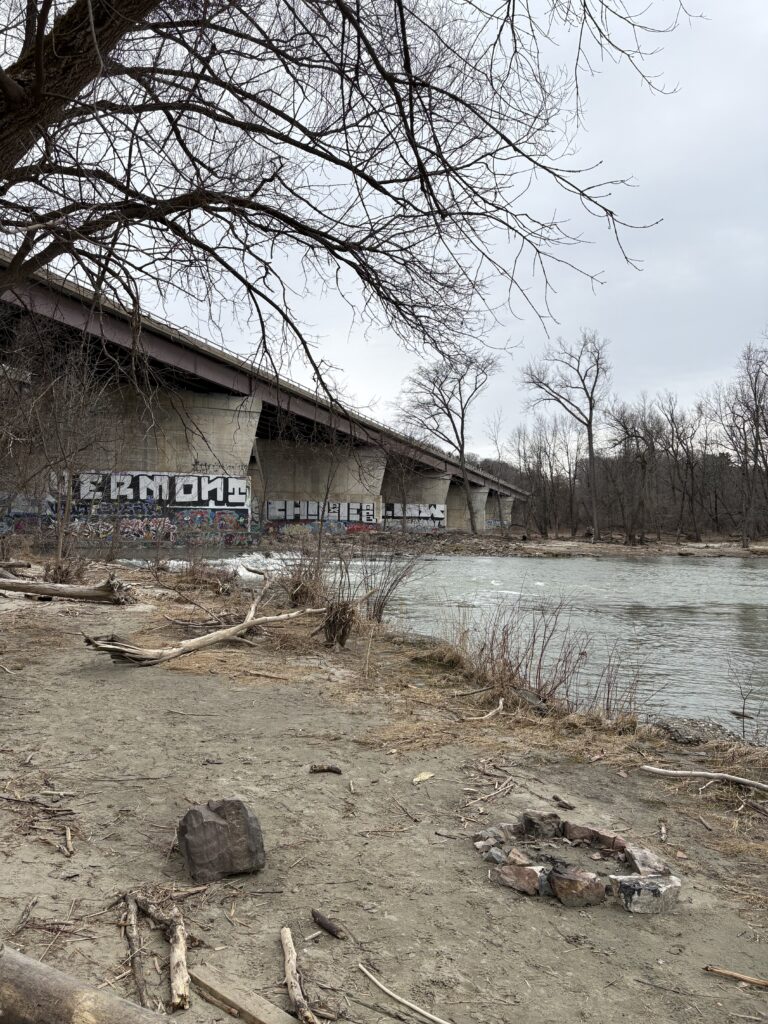
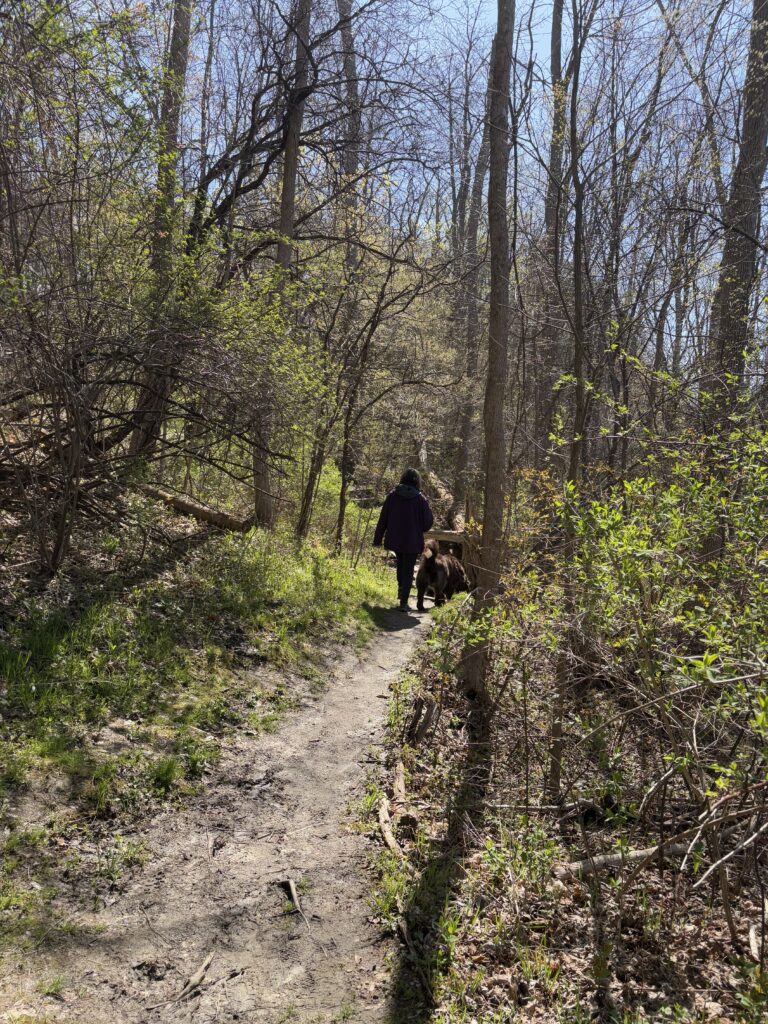
I’ve visited Casavant 3 times this semester in total, with different phenophases being expressed during each visit. Once in January, once in March and once in May. During my trip in January, it was very cold and I didn’t make it far down the trail. In March (for lab), I walked all the way down to where the natural area bordered the Winooski River. This last visit, I walked the entire loop. I am very excited to see how the park changes over the course of summer.

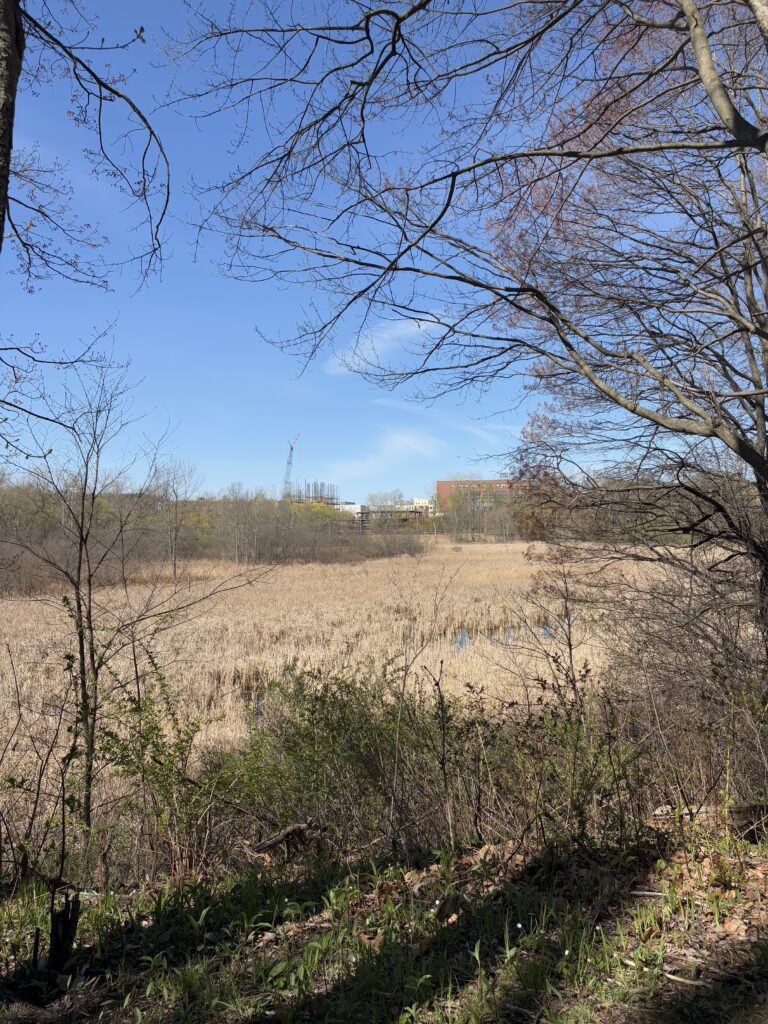
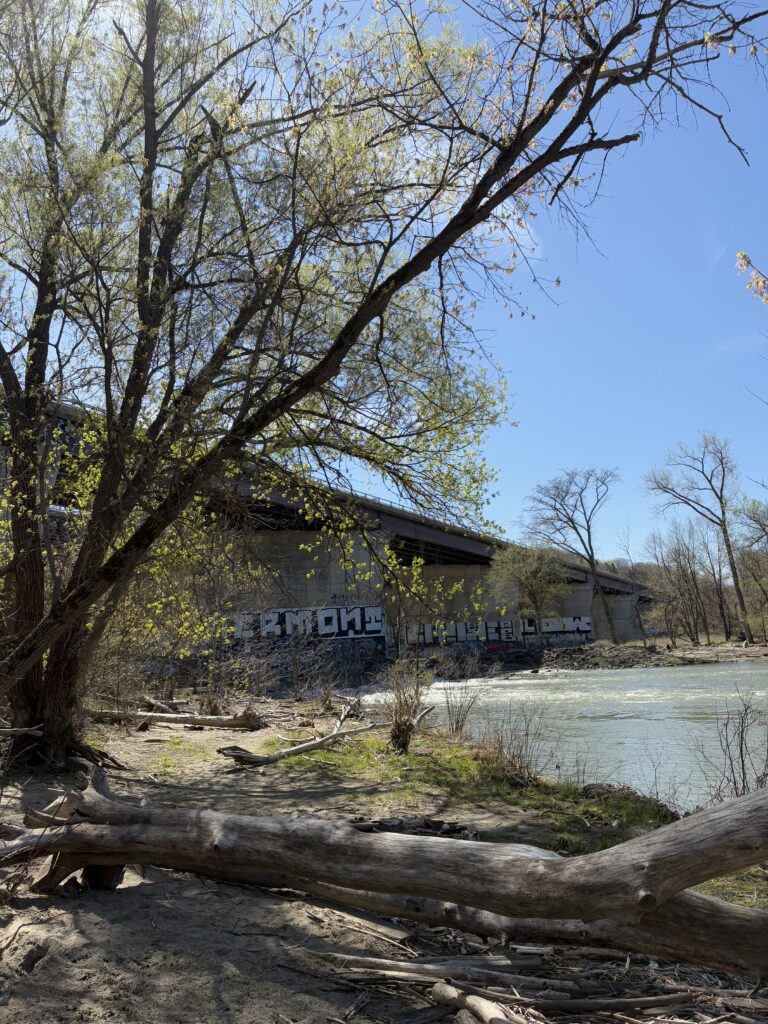
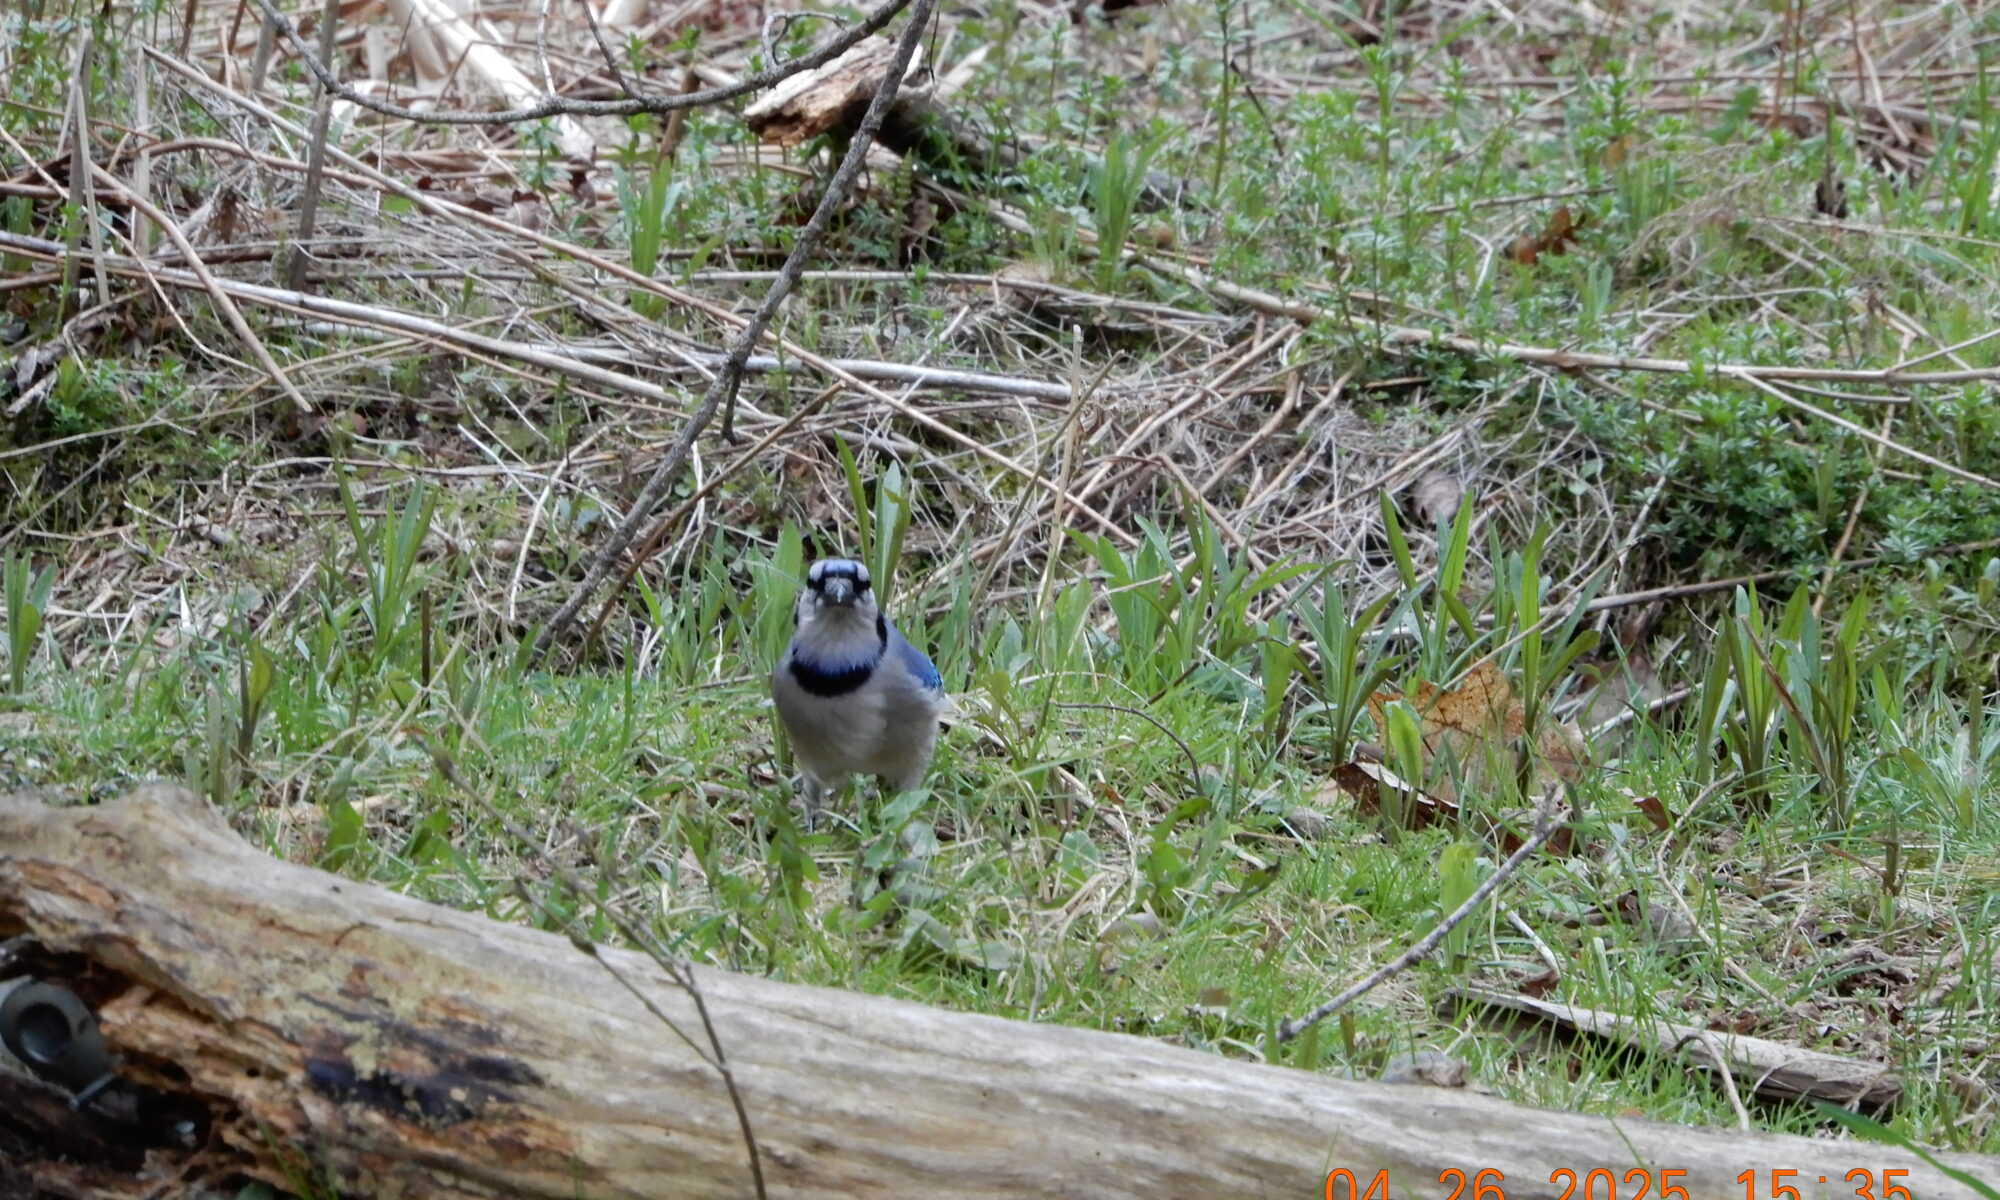
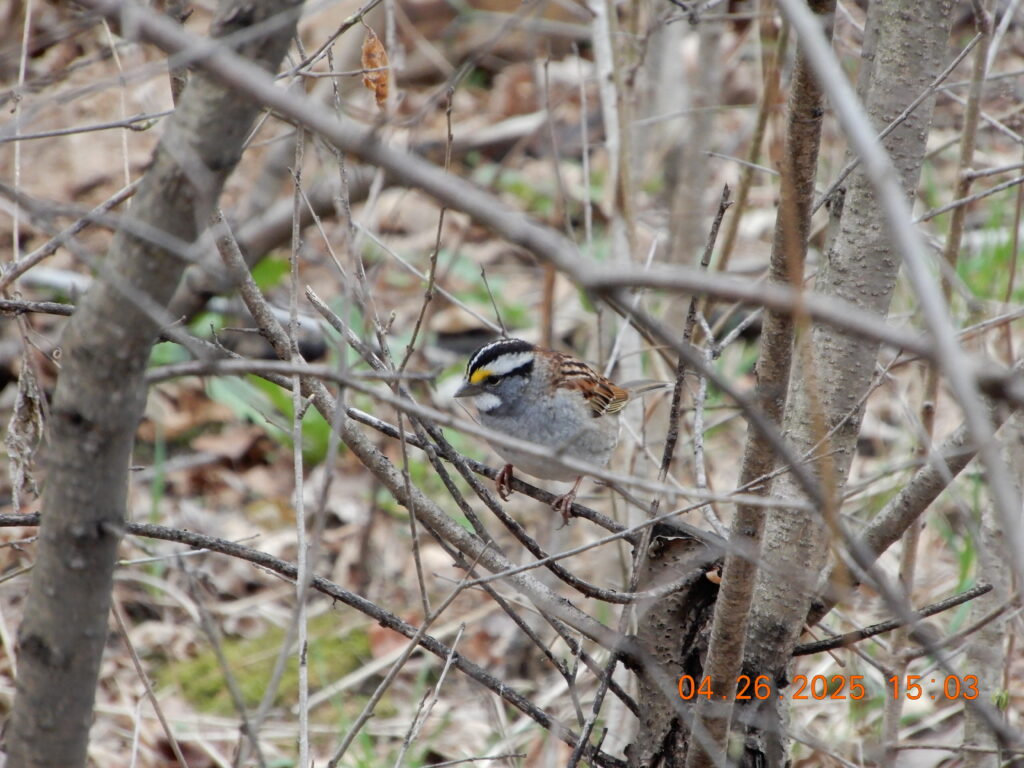
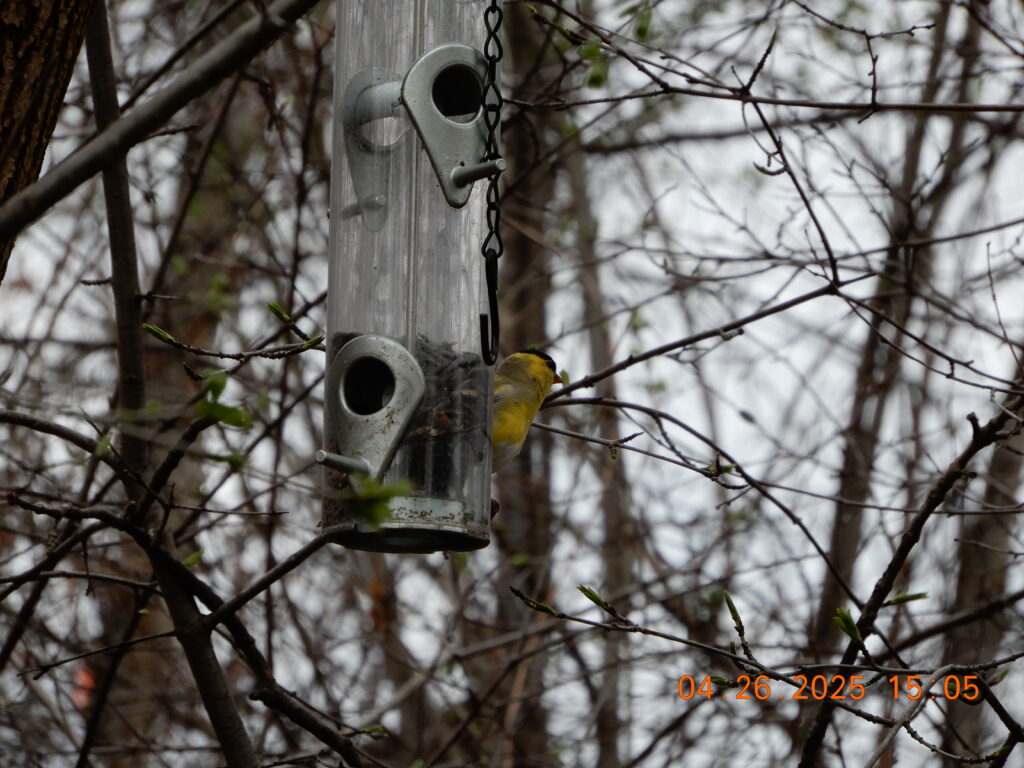
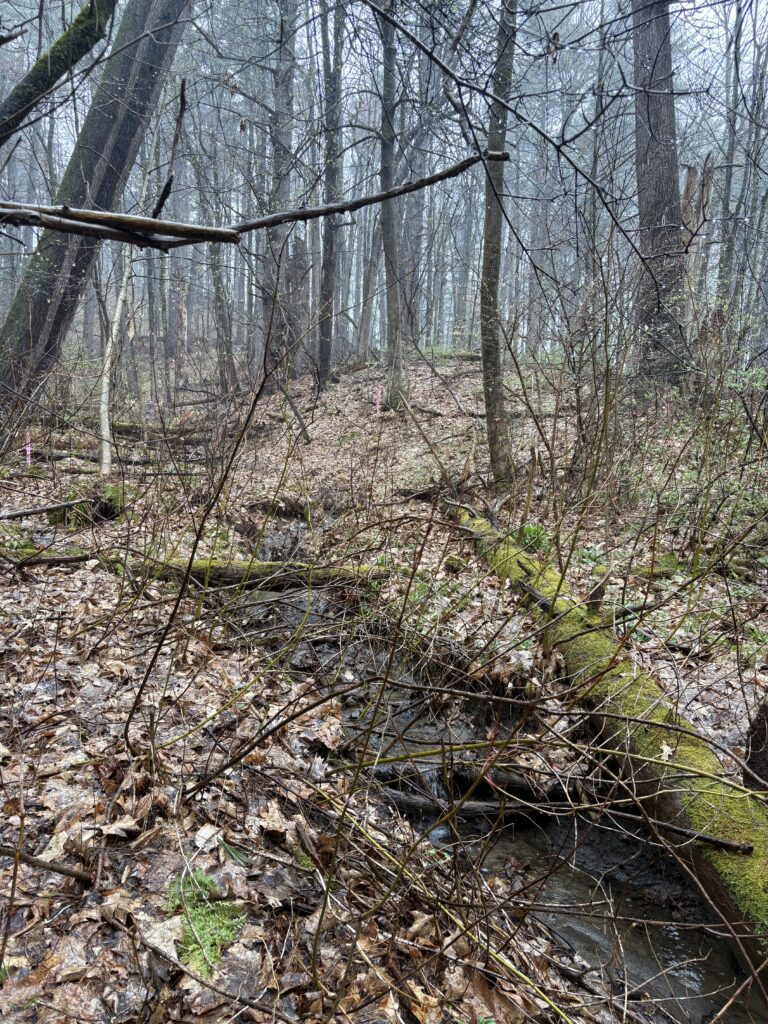
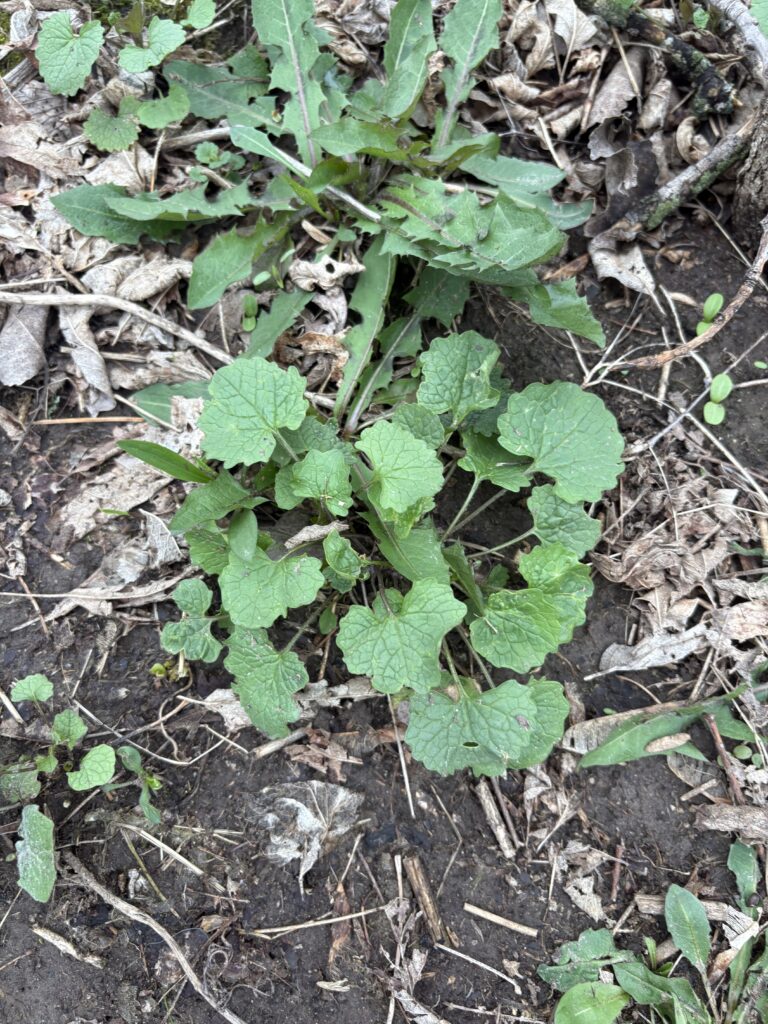
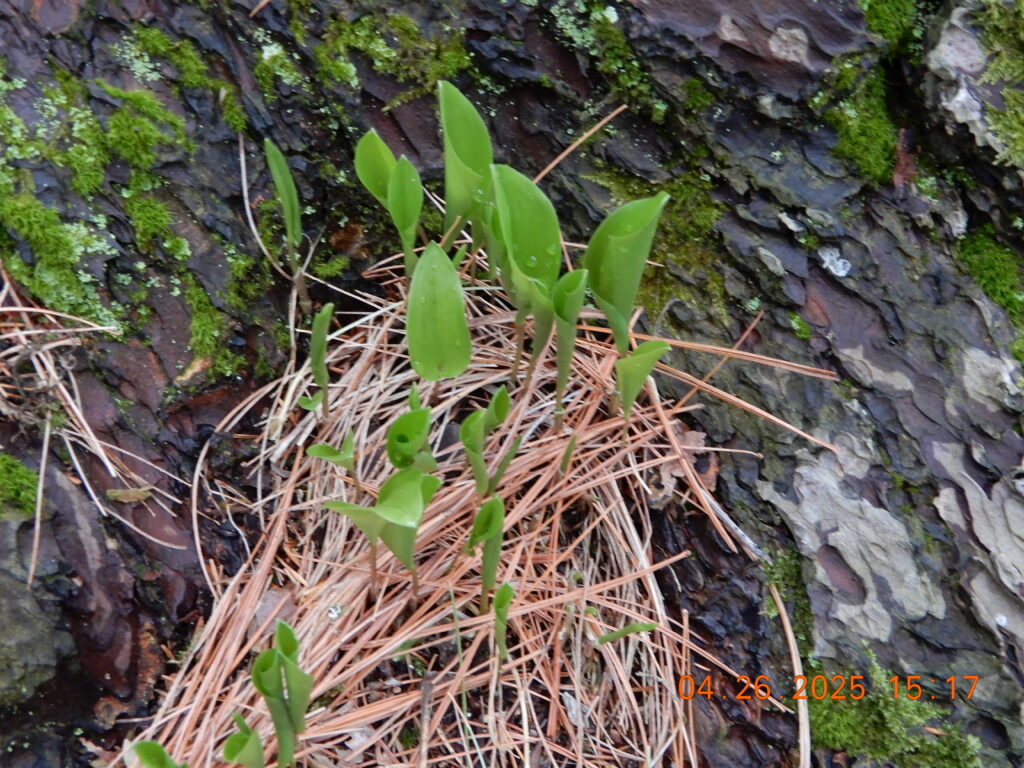
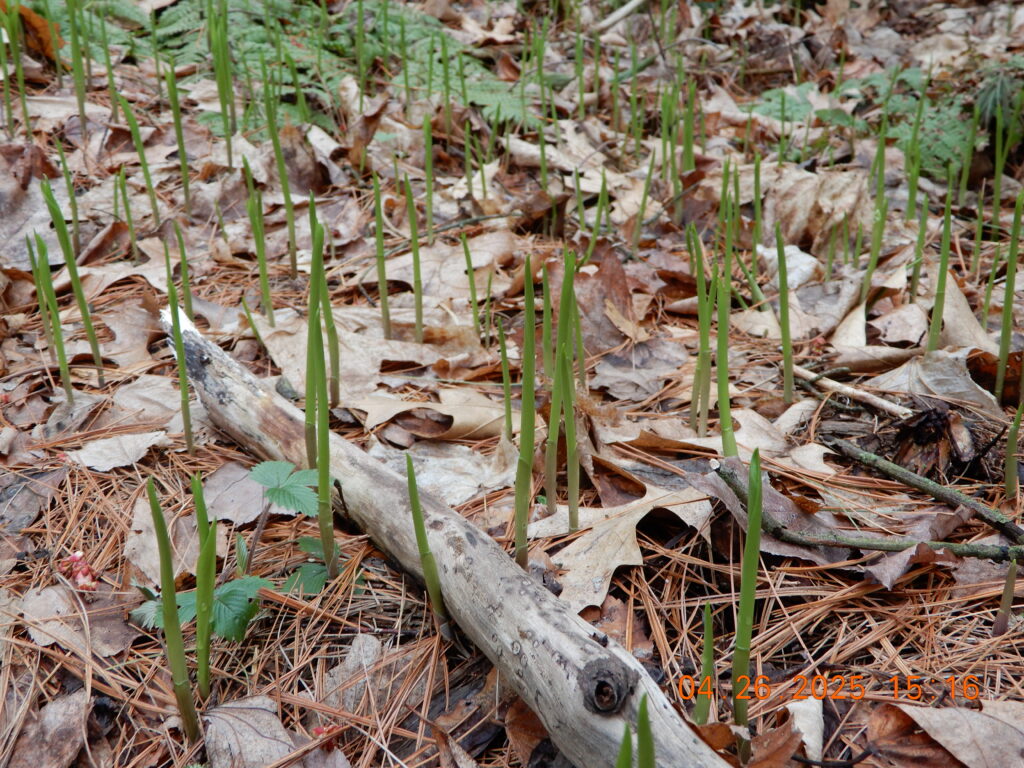
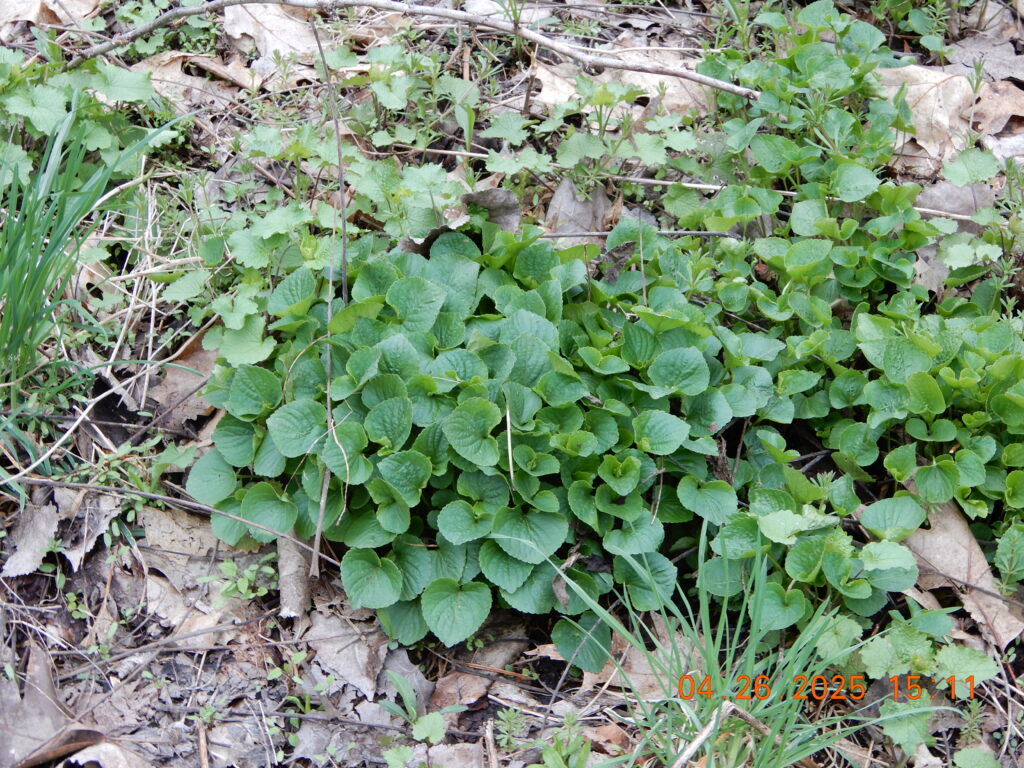
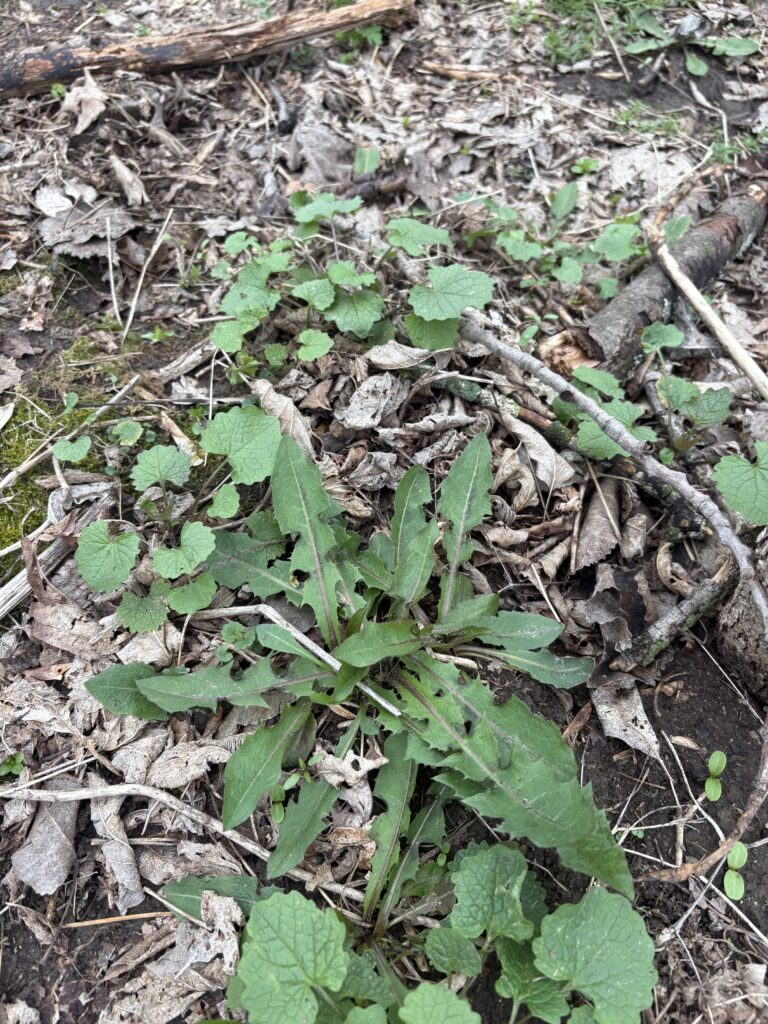
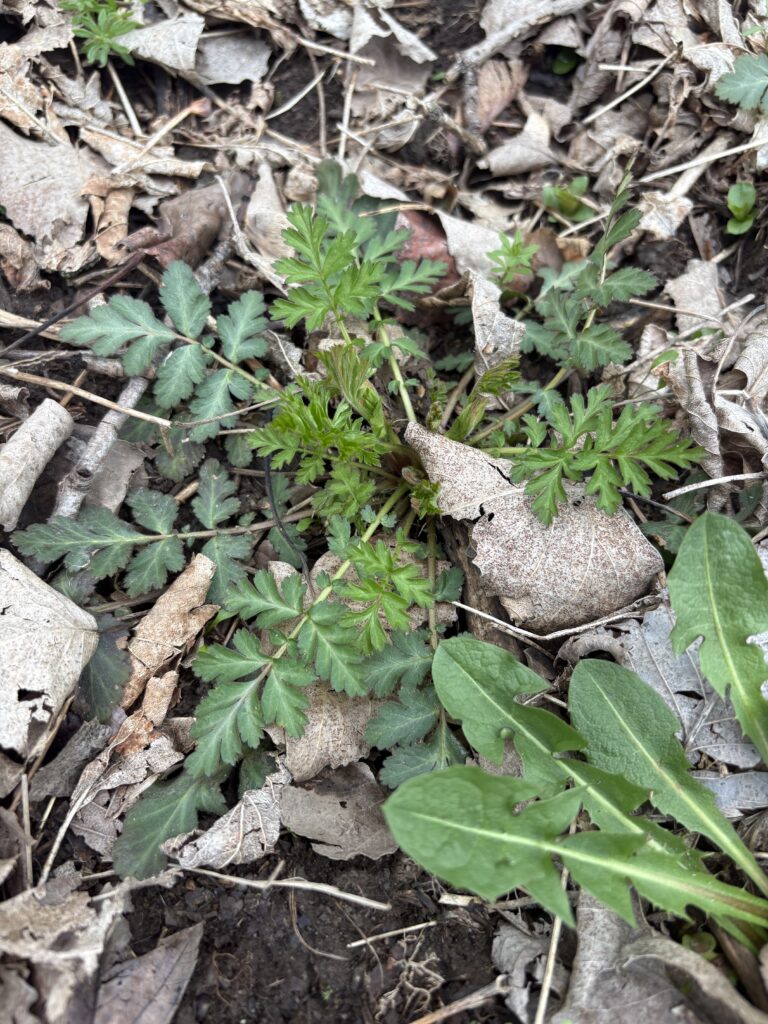
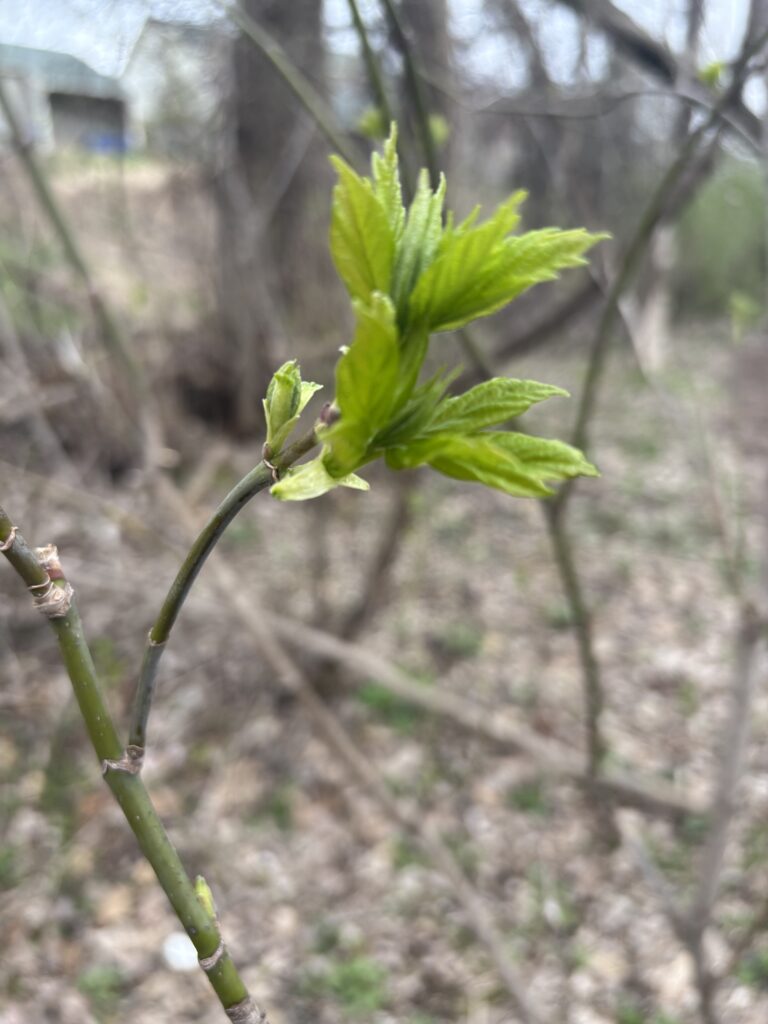
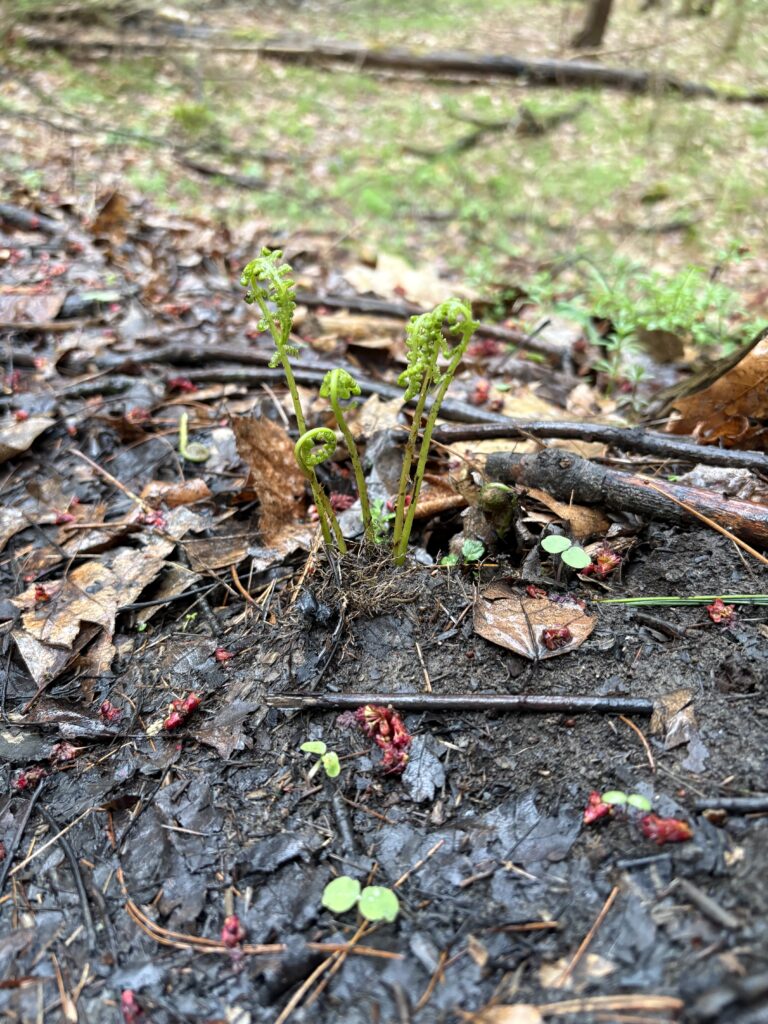
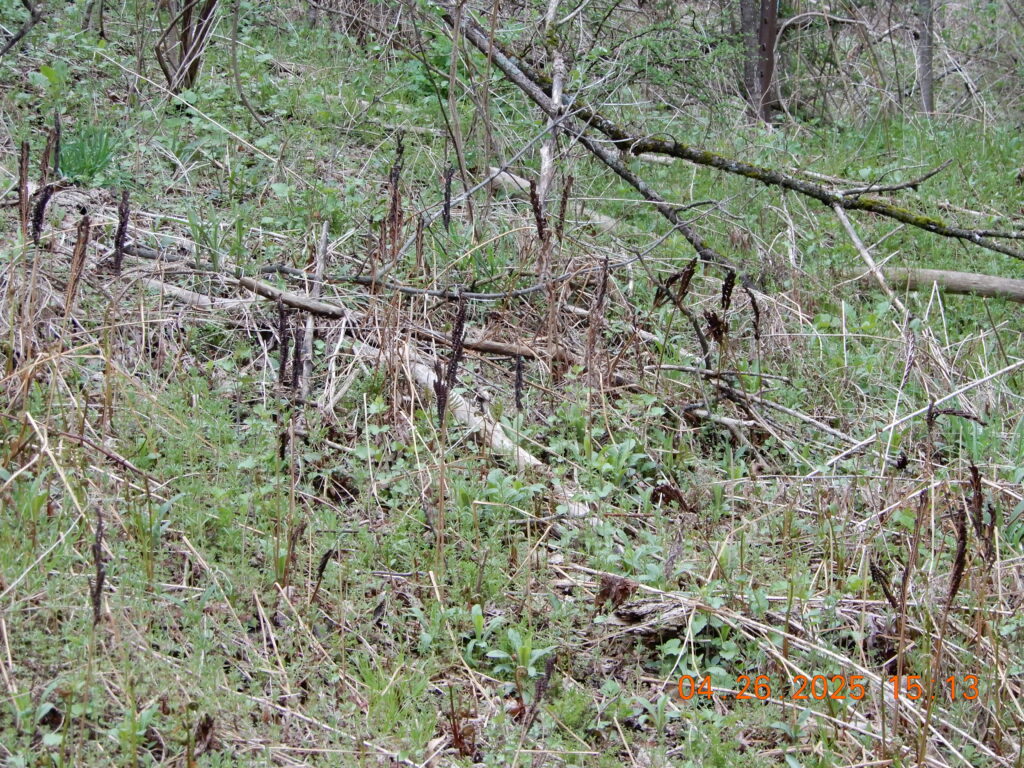
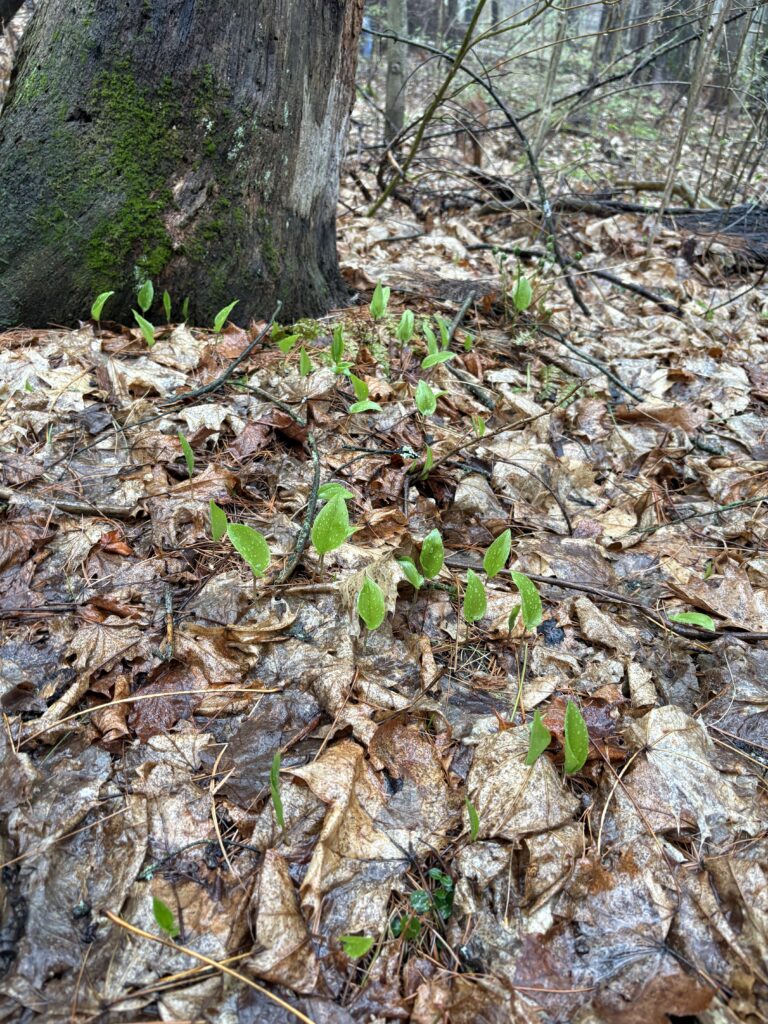
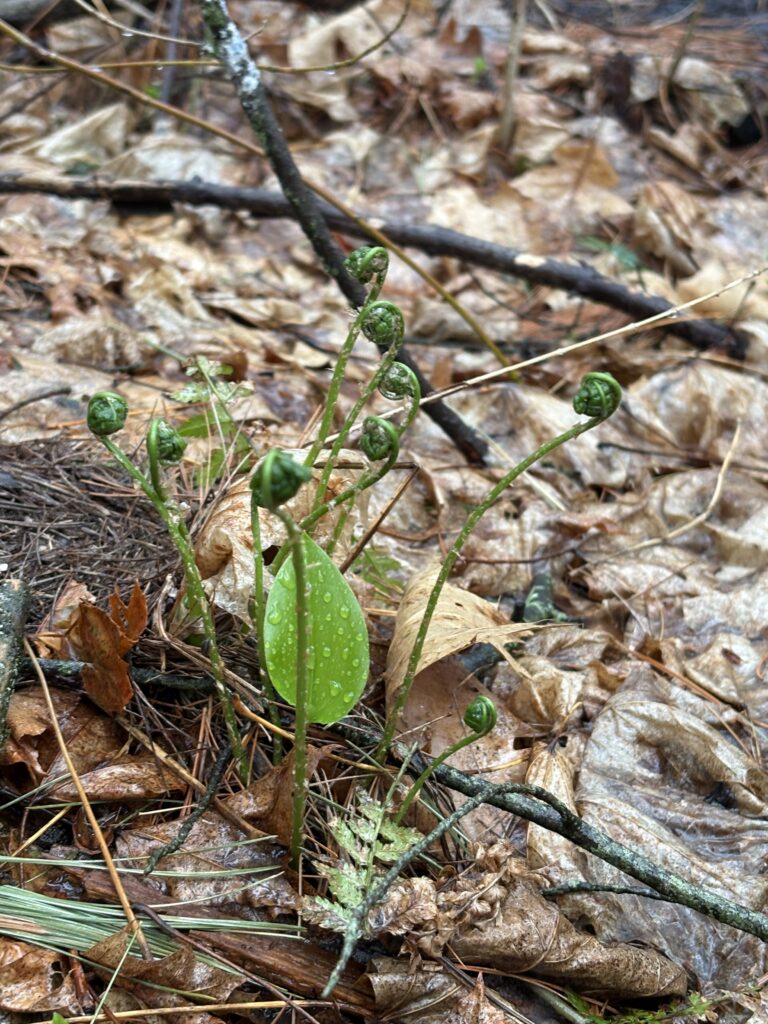
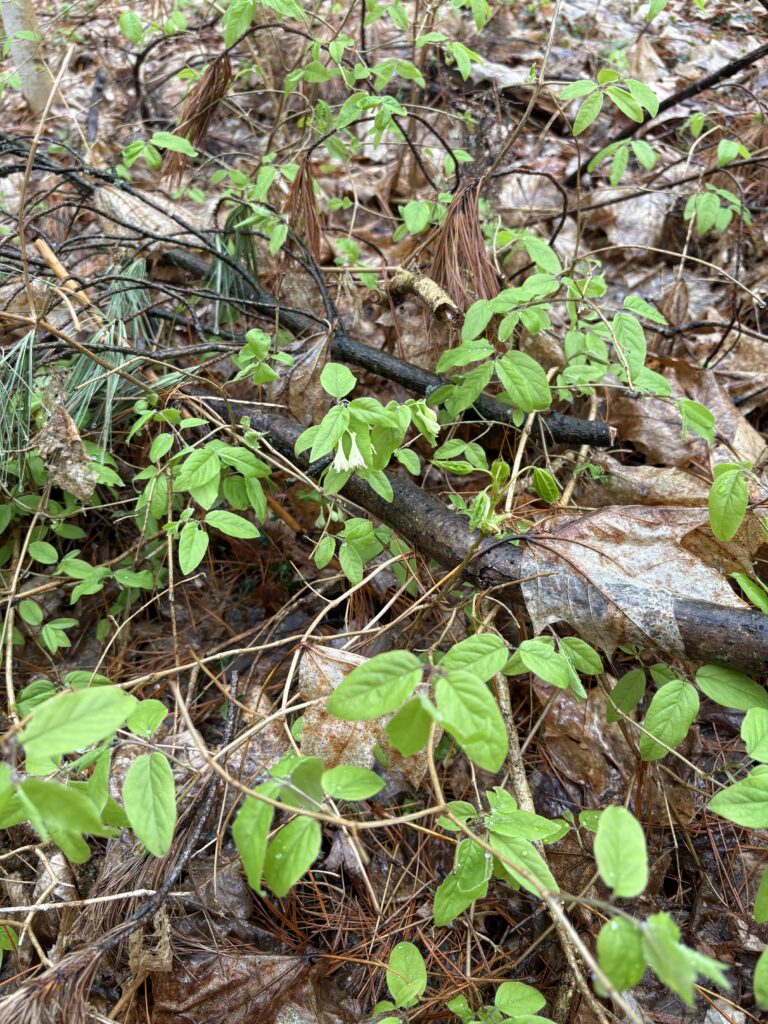
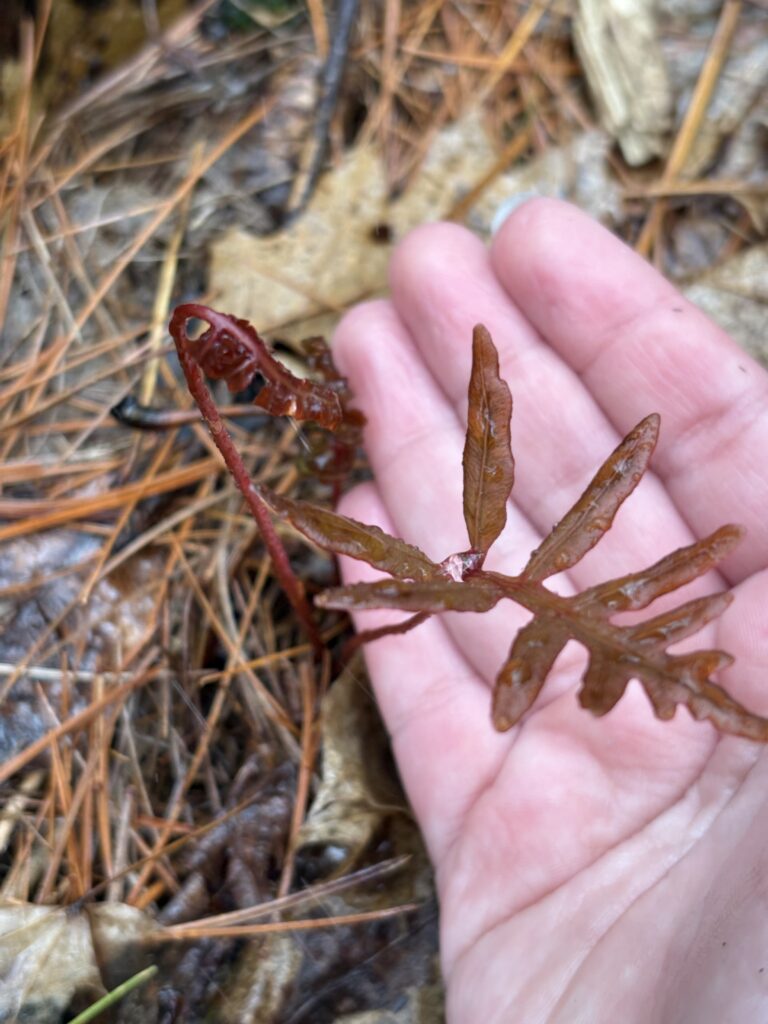
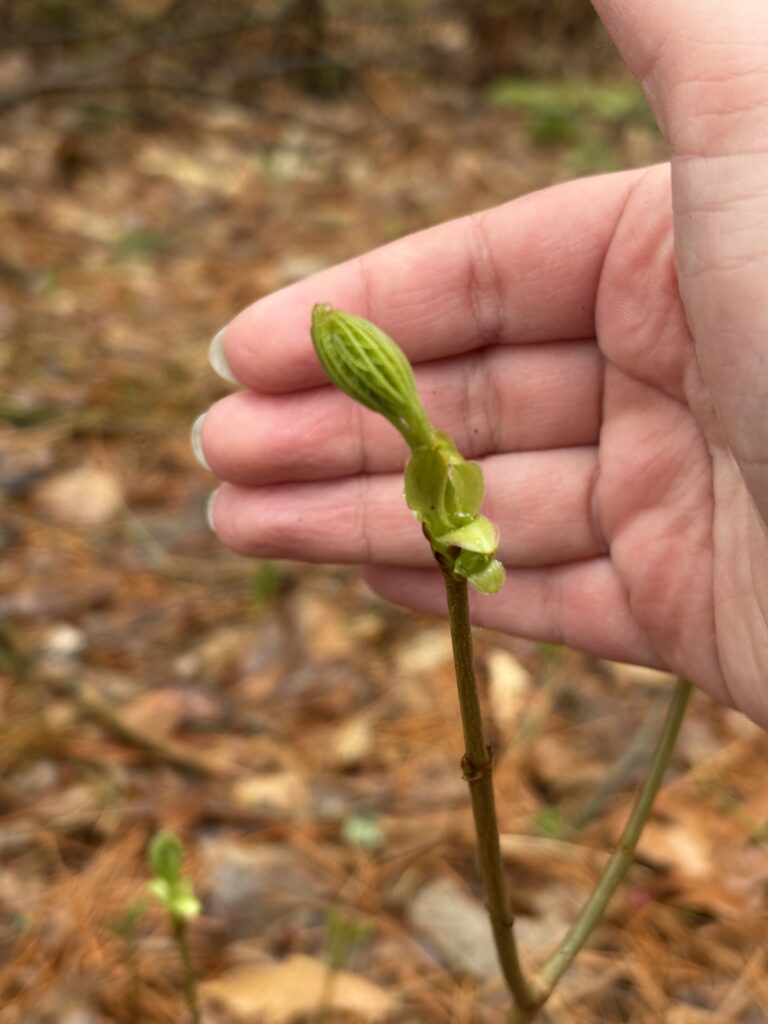
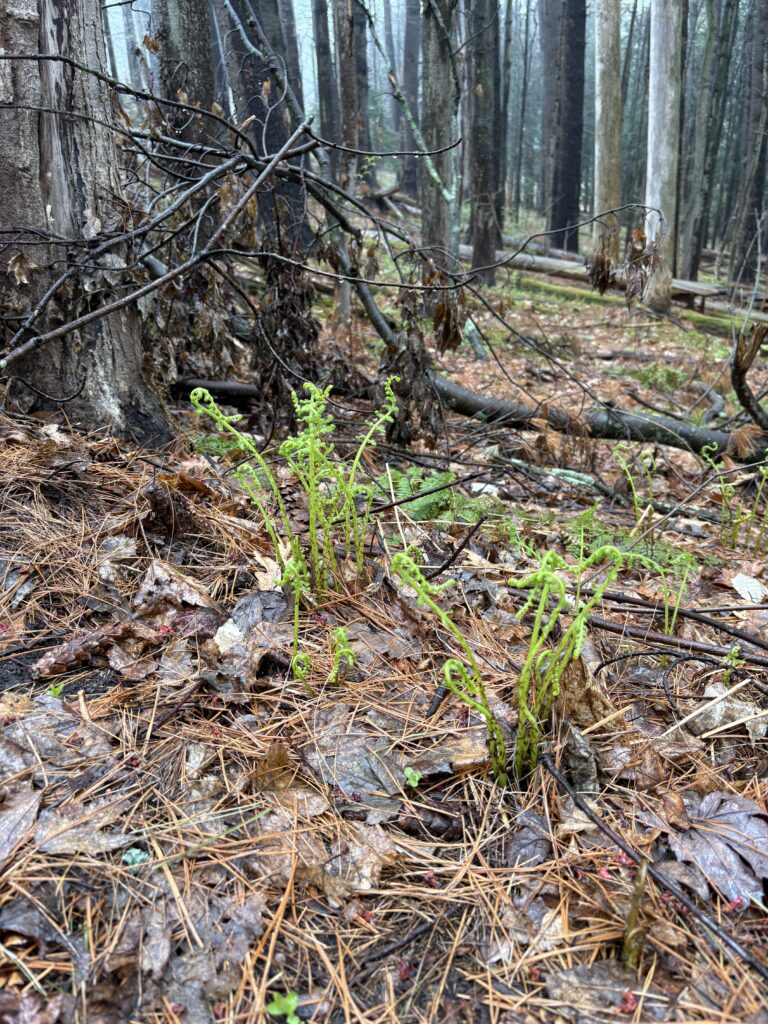
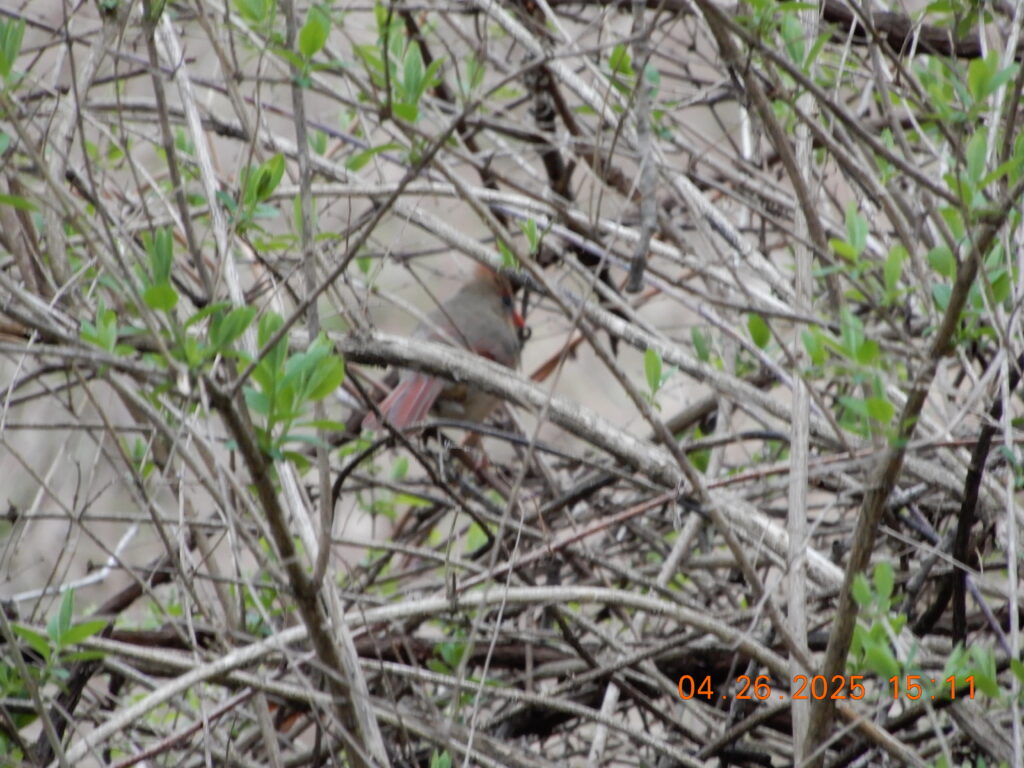
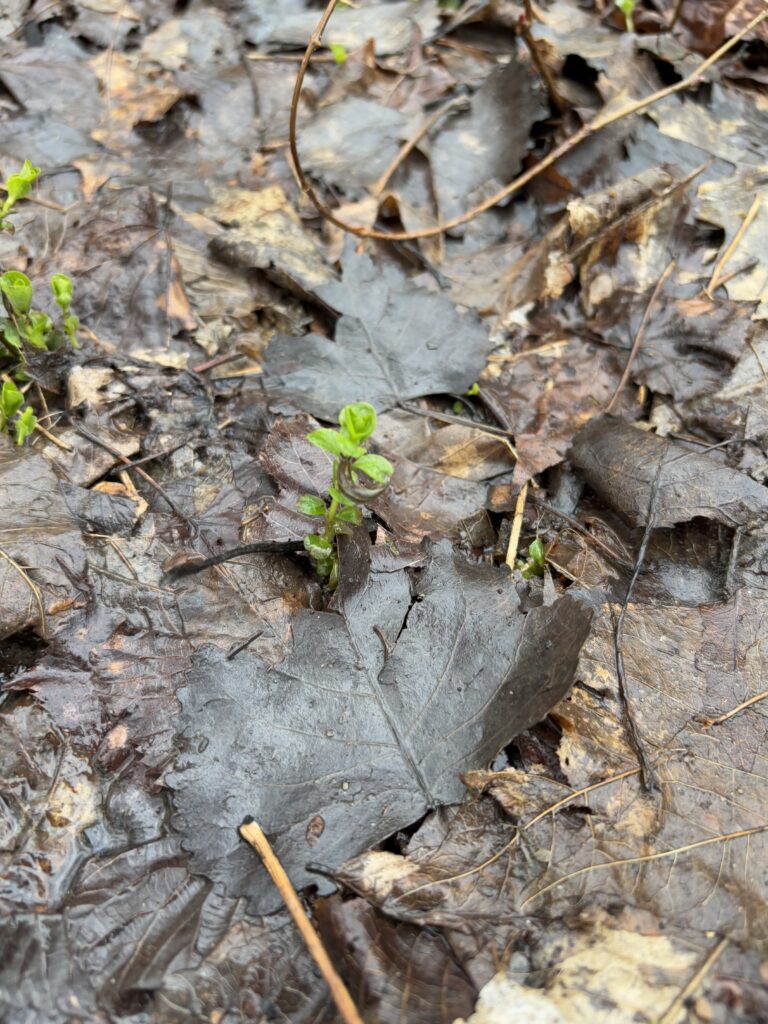
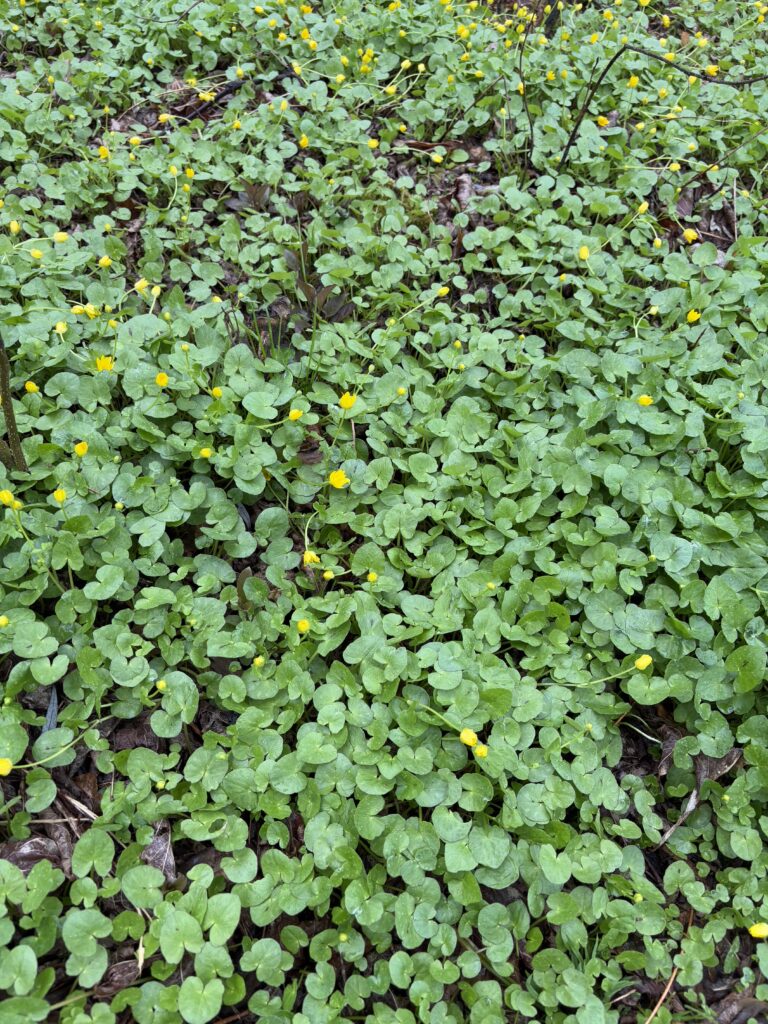
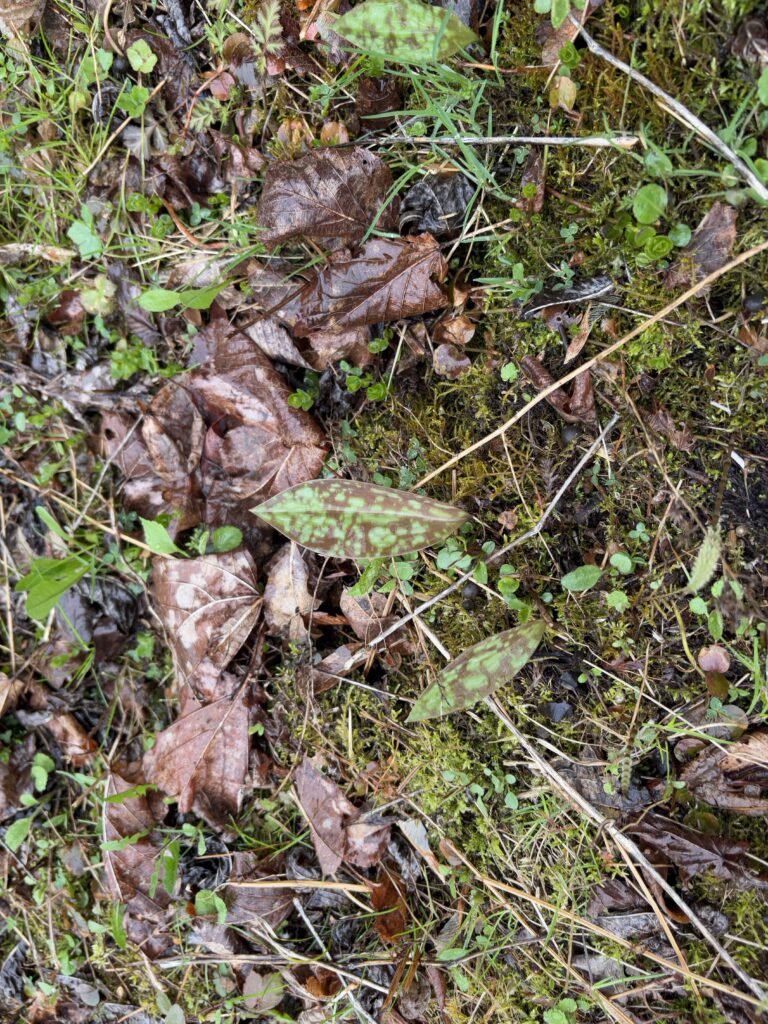
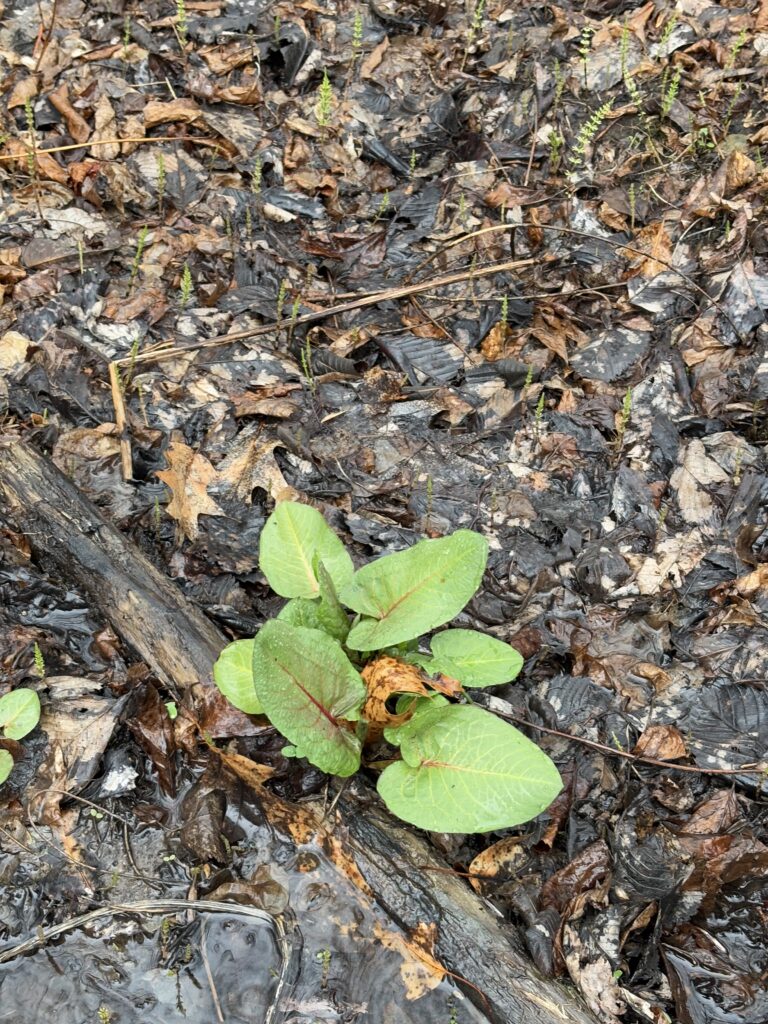
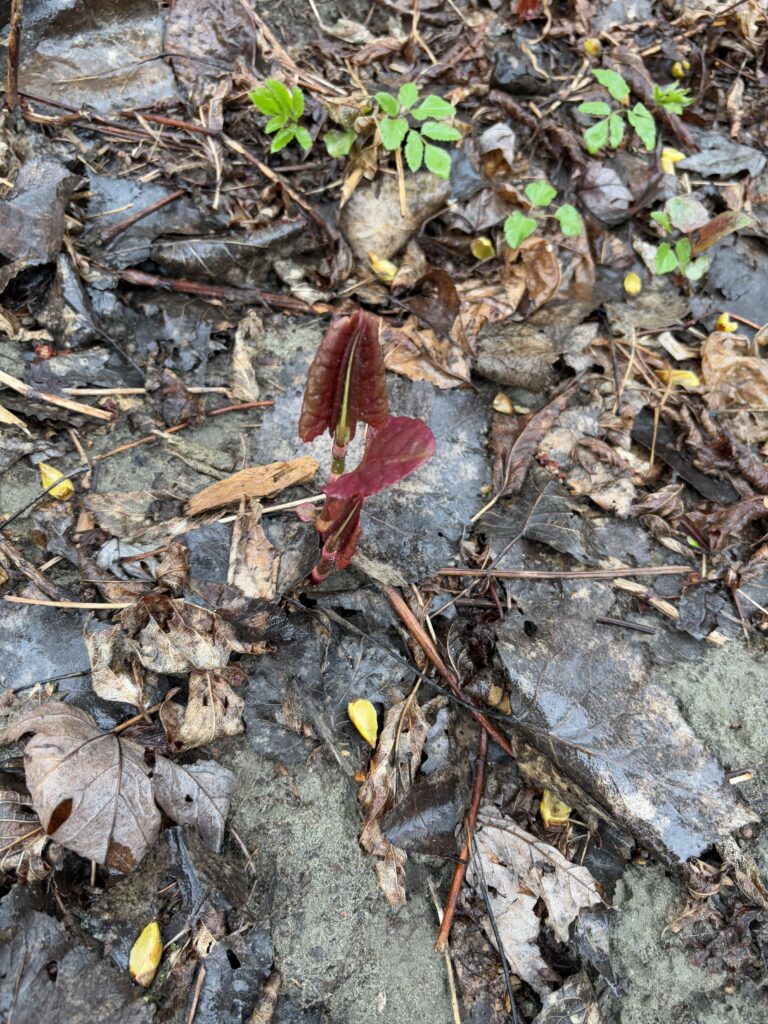
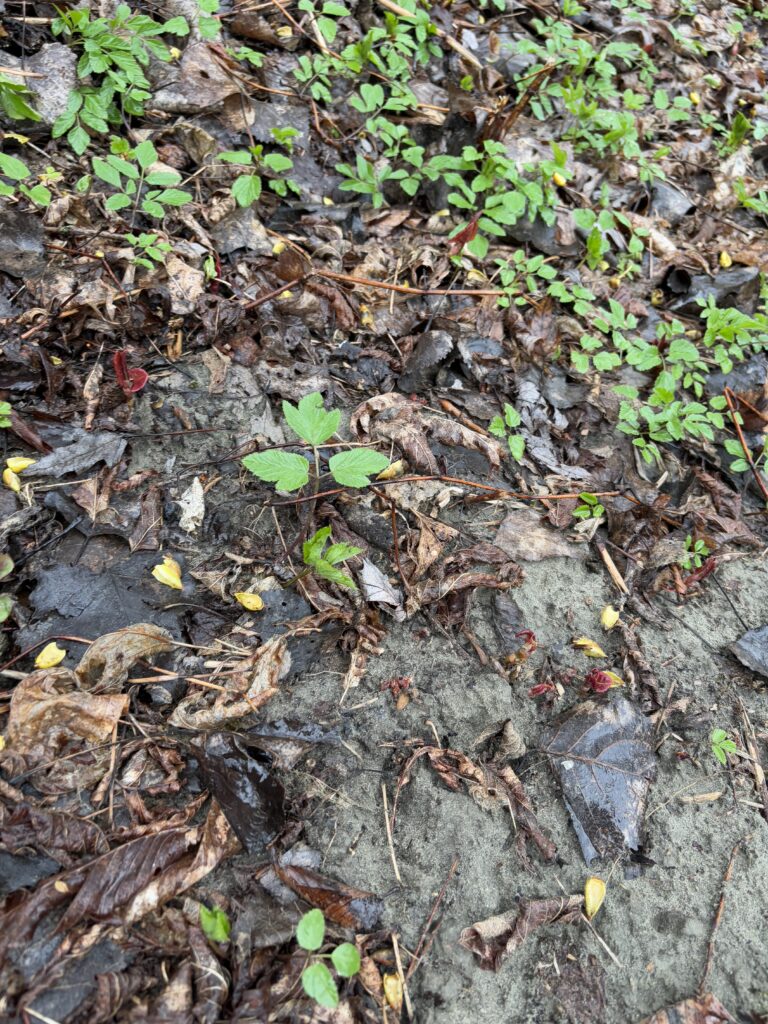
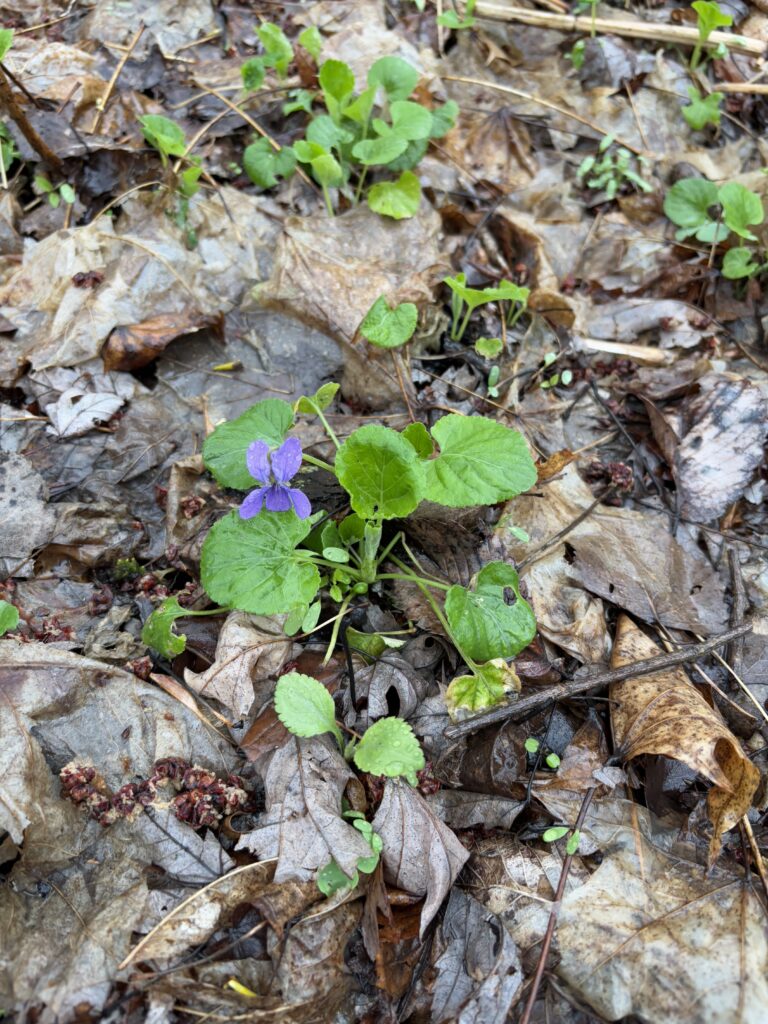
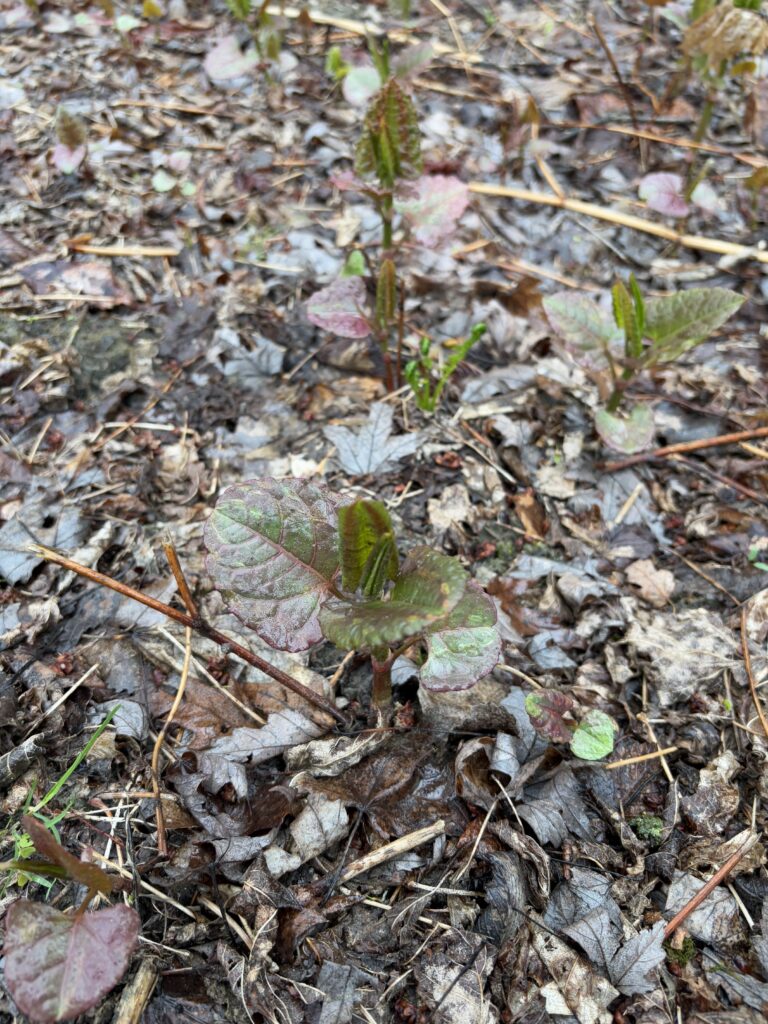
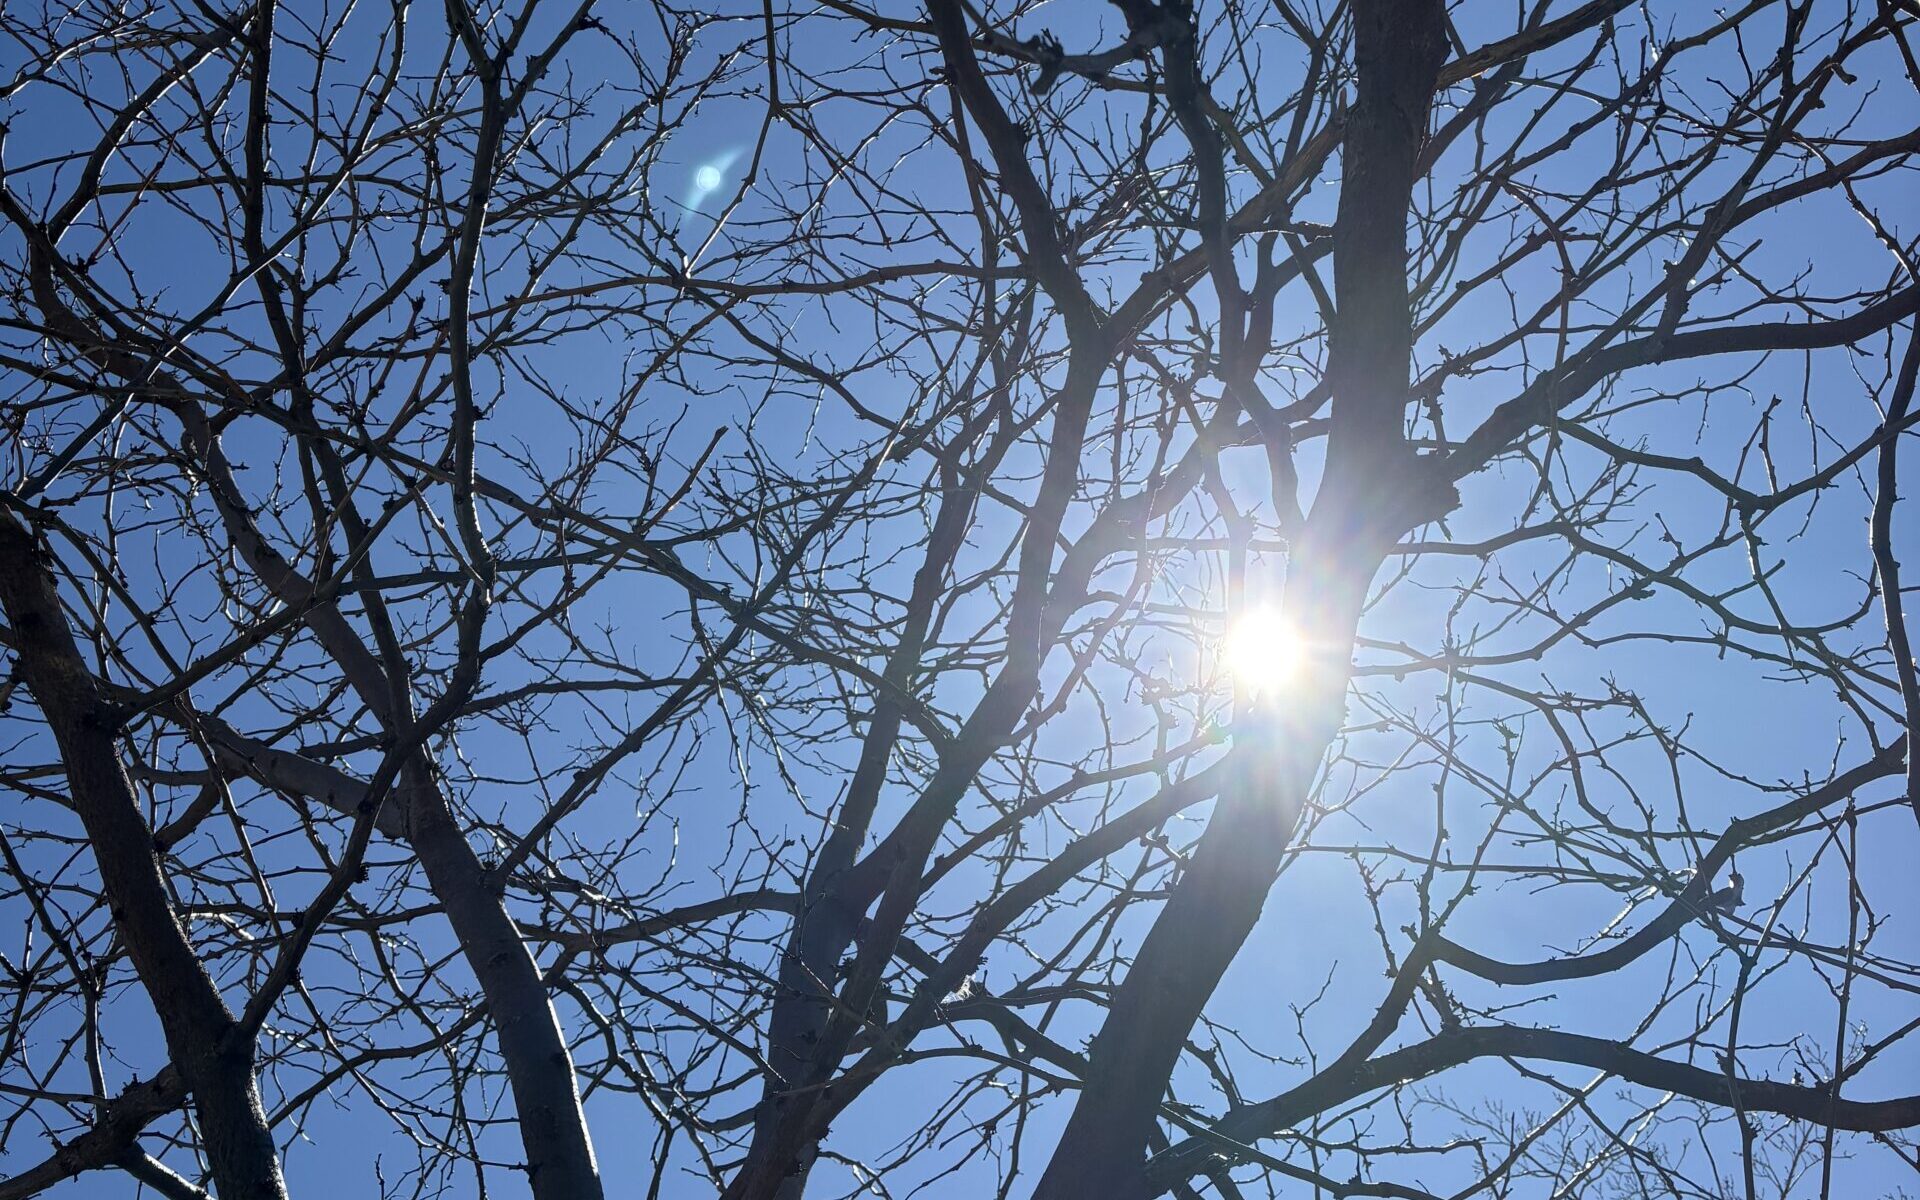
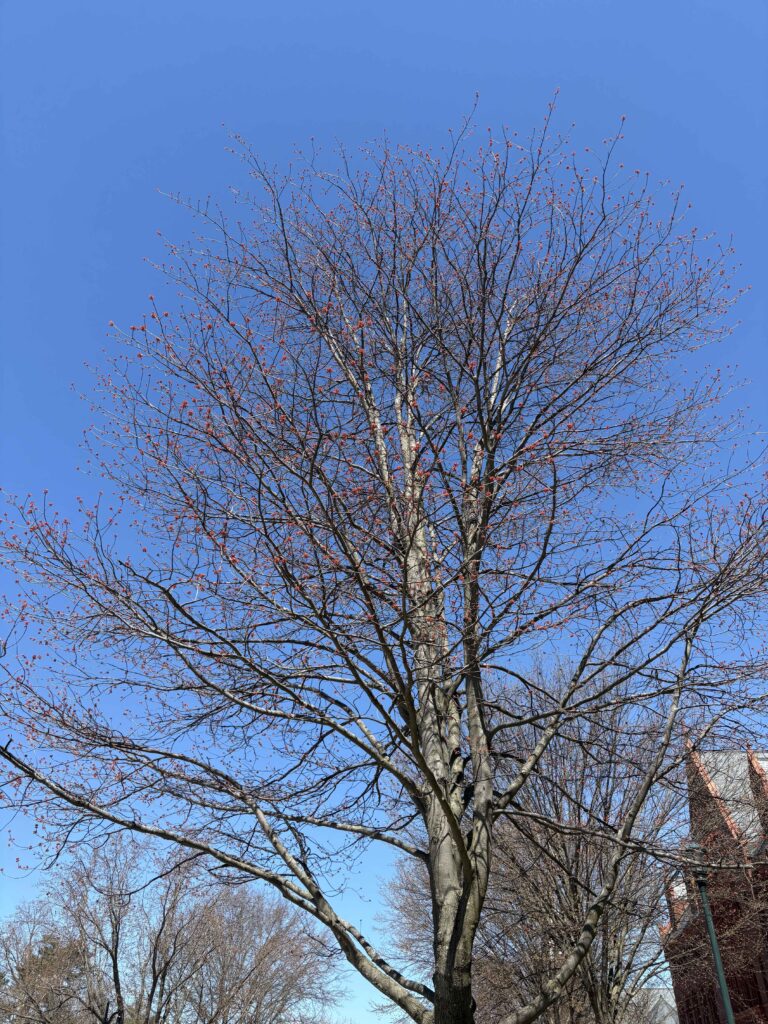
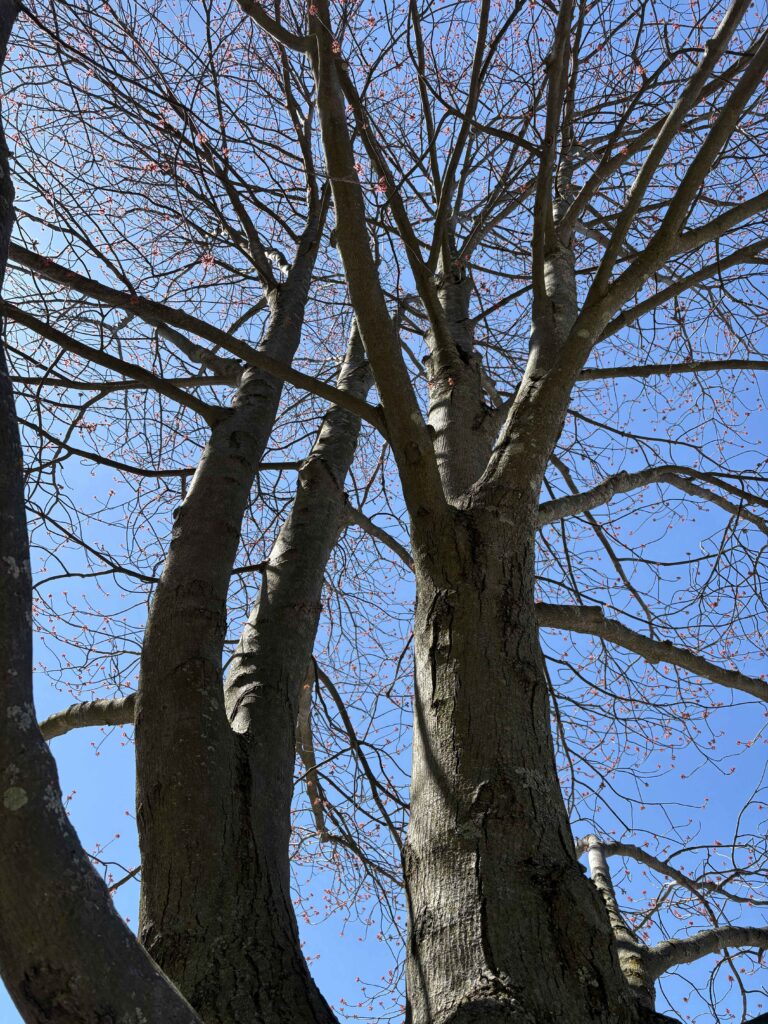
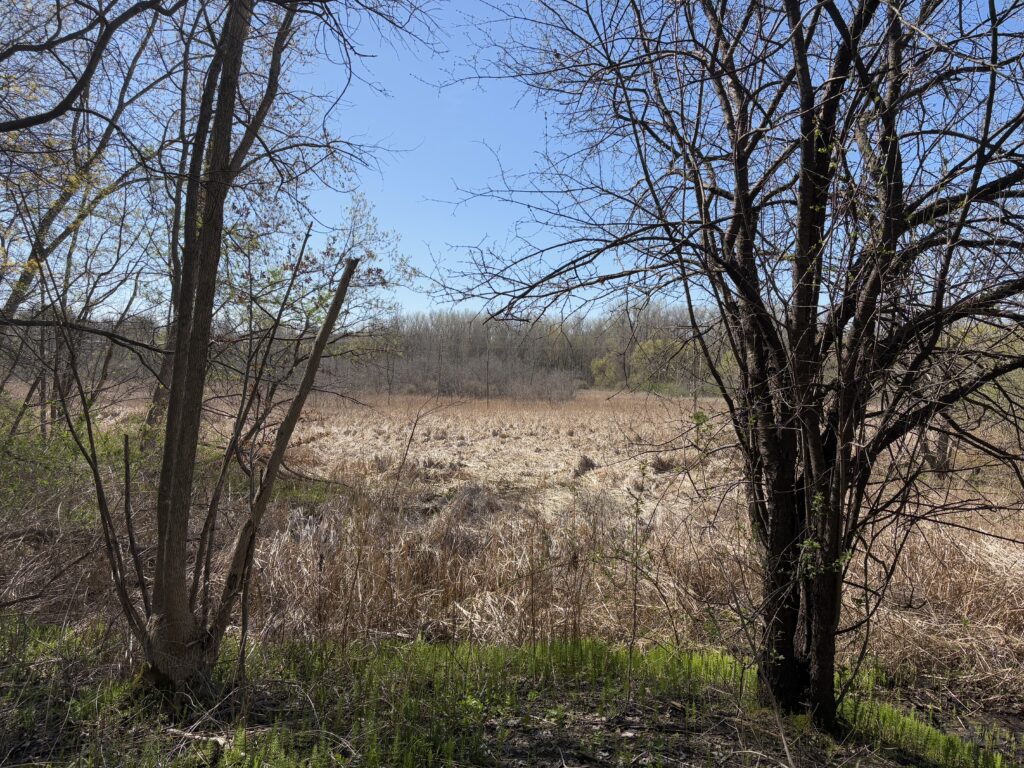
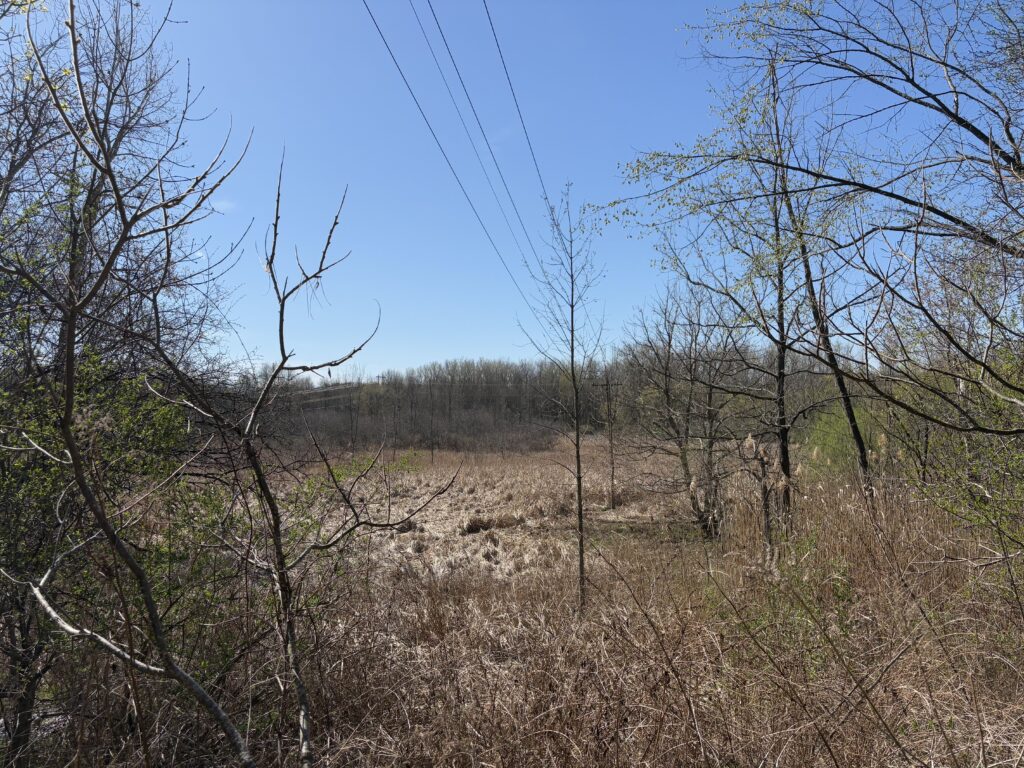
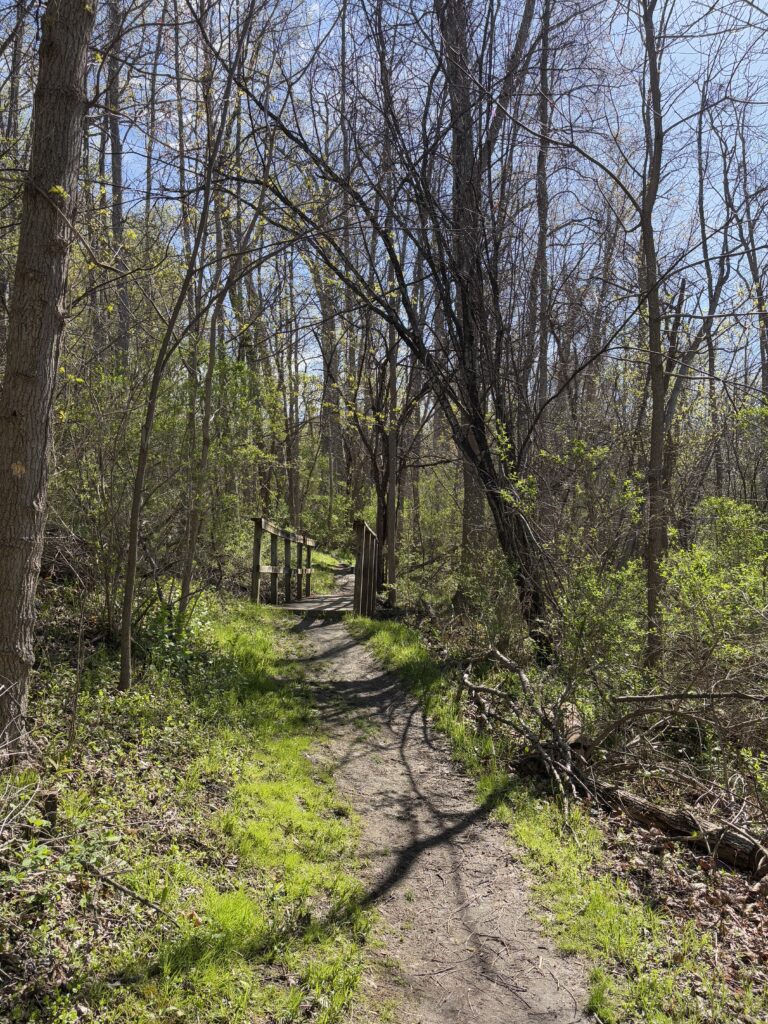
The most visible changes from my first to last visit is the melting of snow and regrowth of groundcover. Ferns, flowering species, grasses and other understory species are flourishing. Most trees have began budding, but only a quarter of the buds have broken and began growing new leaves.
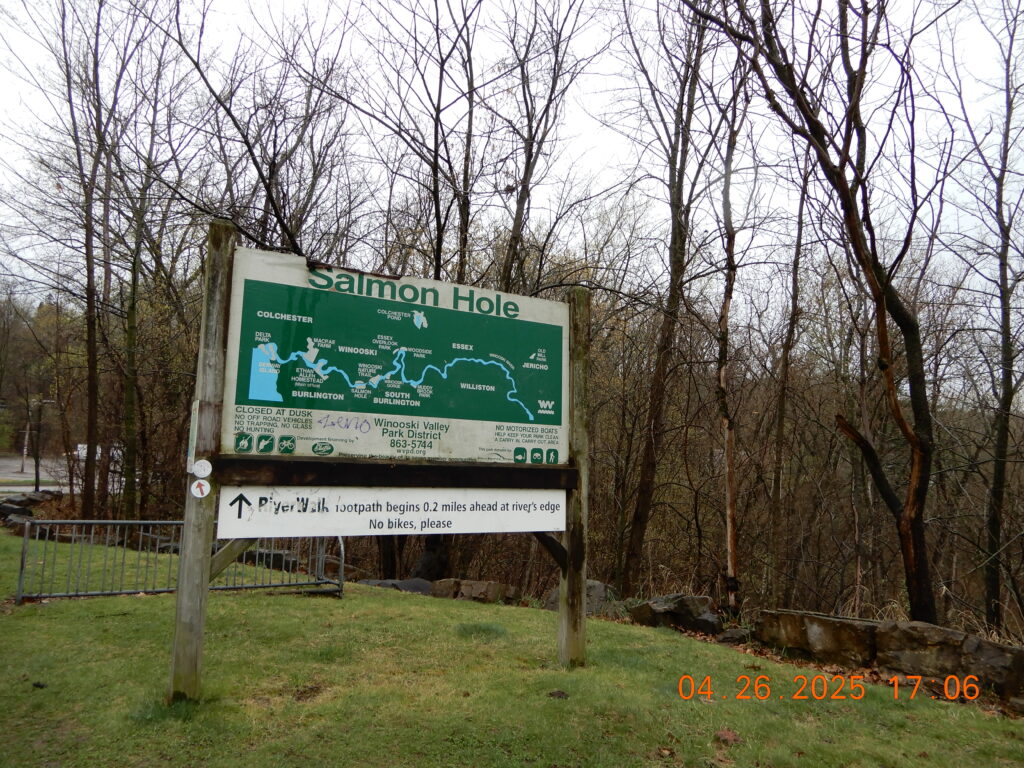
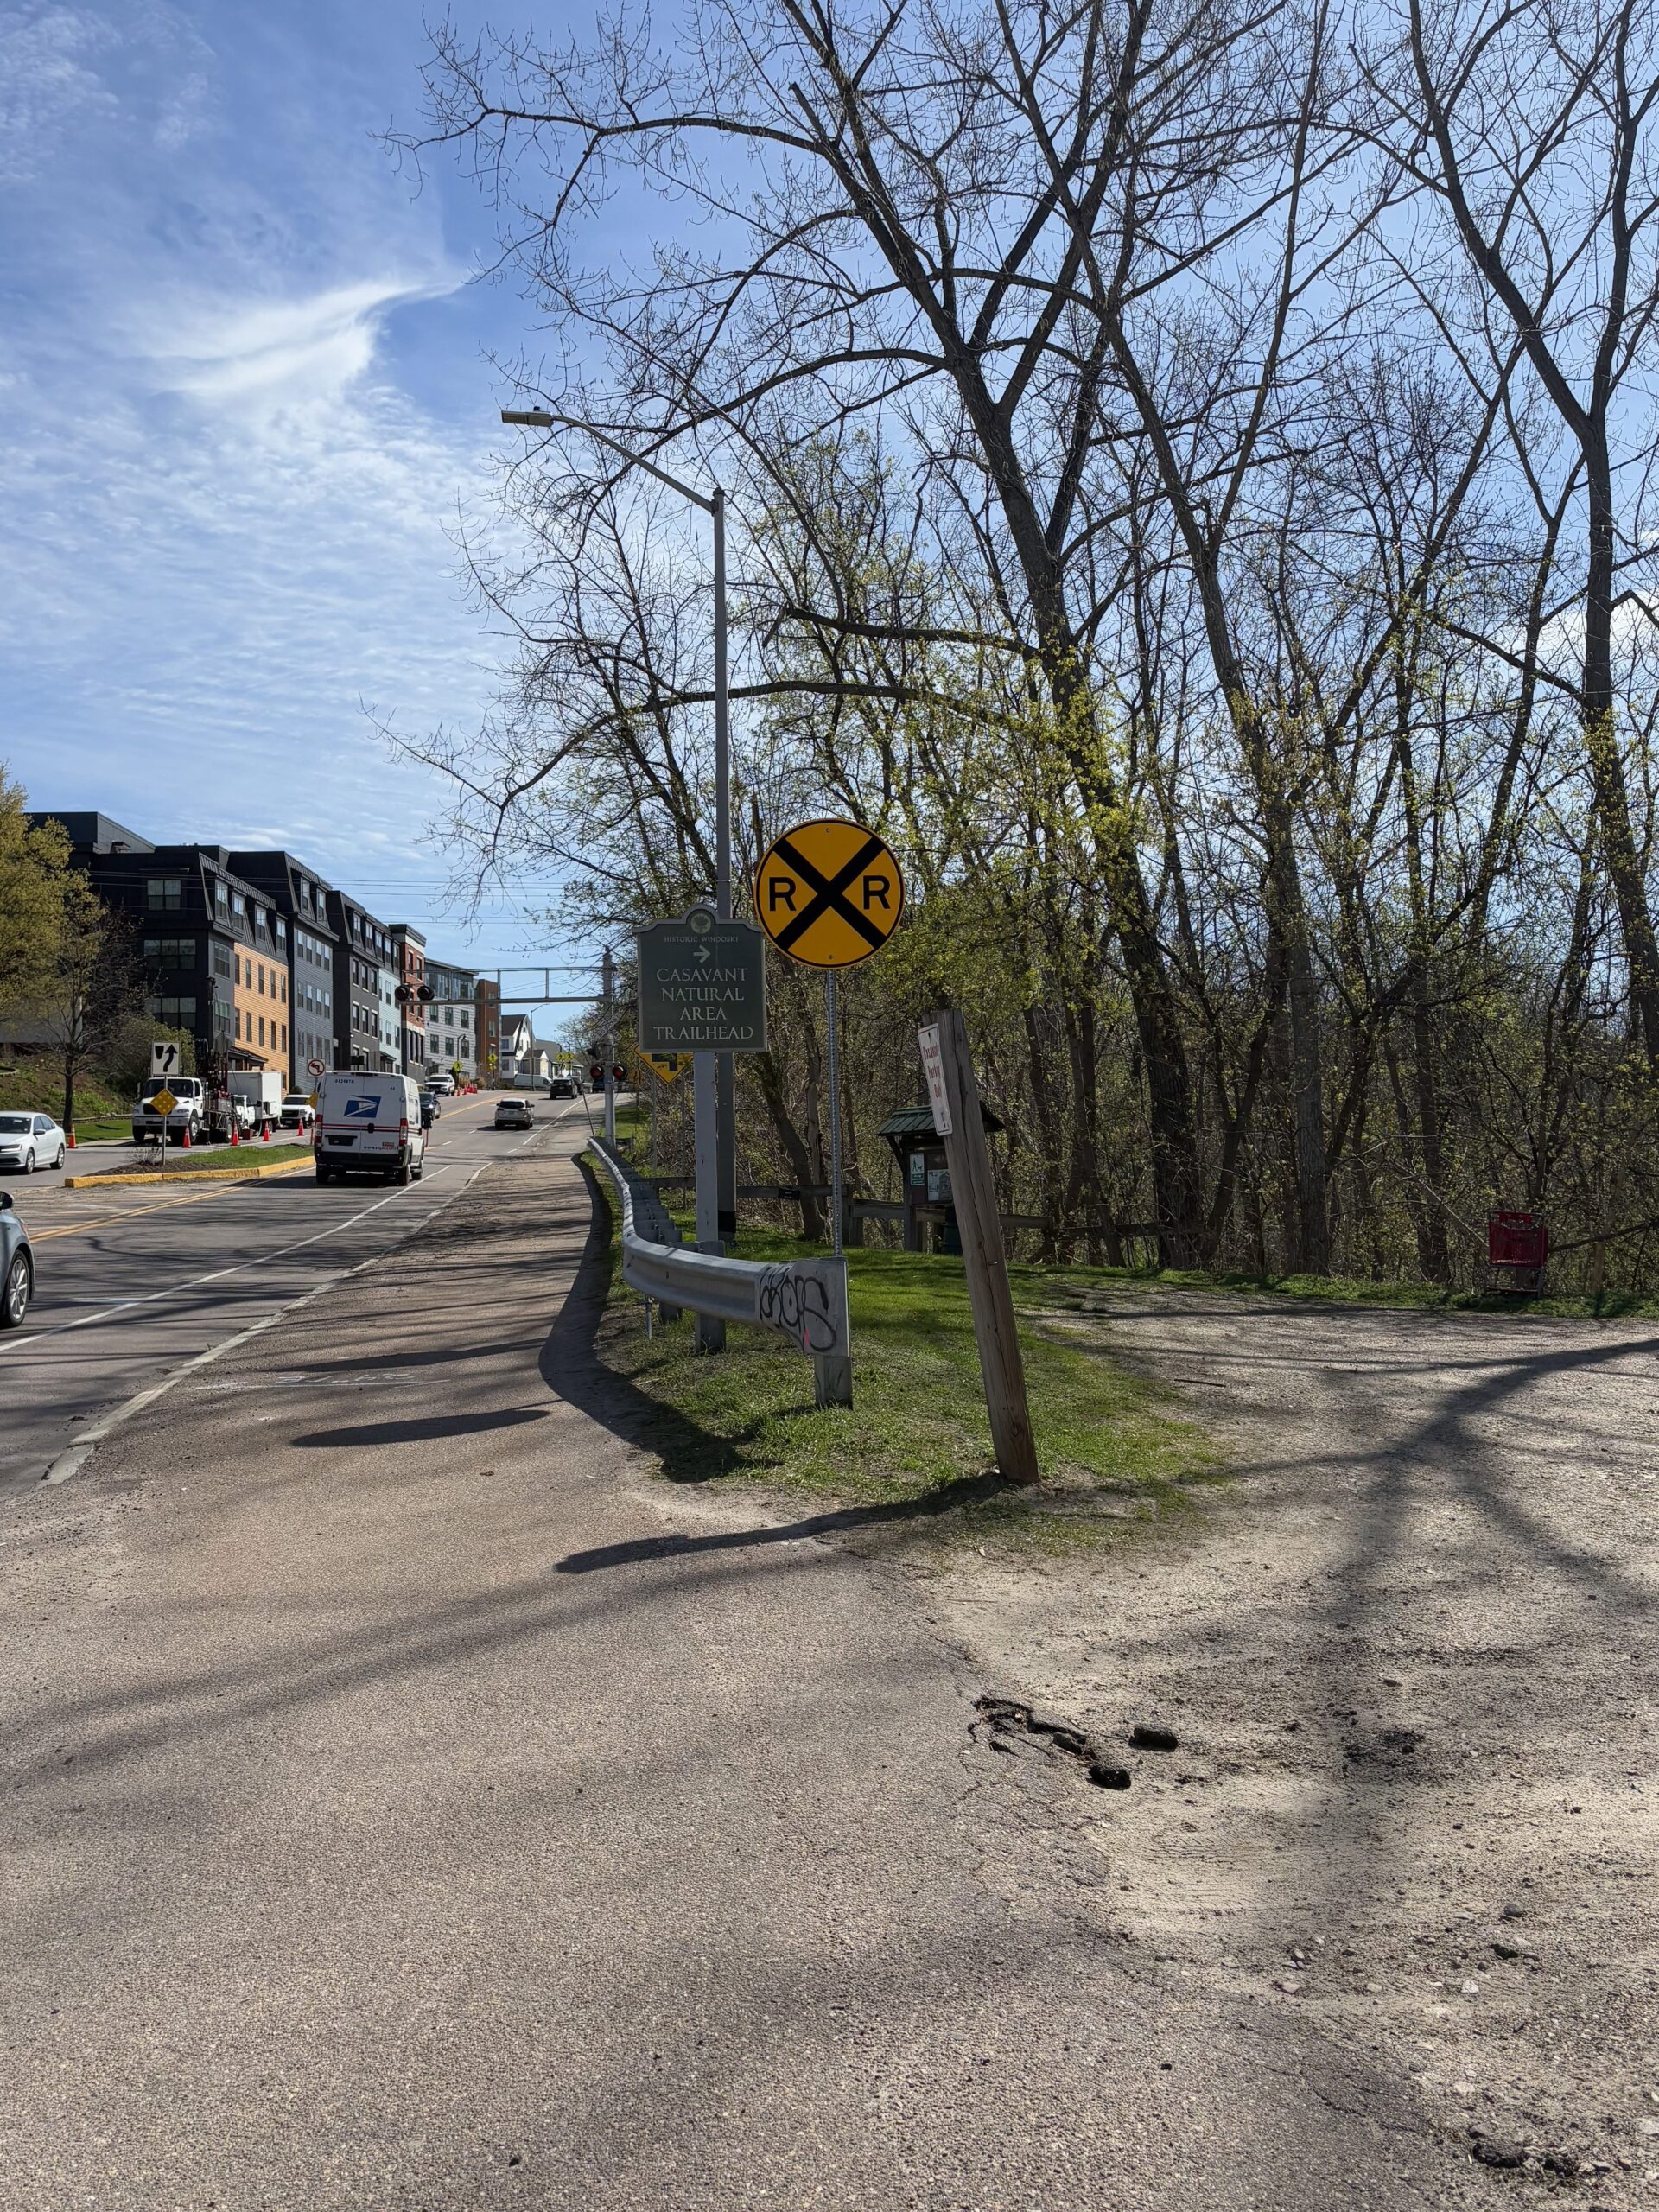
Landmarks

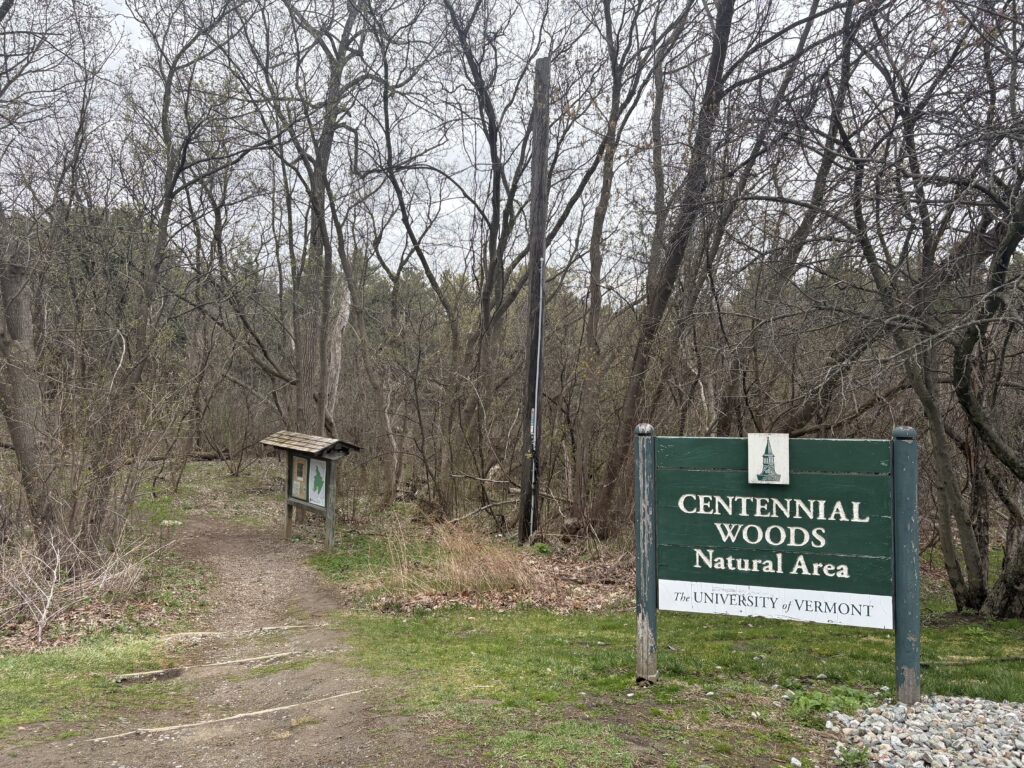
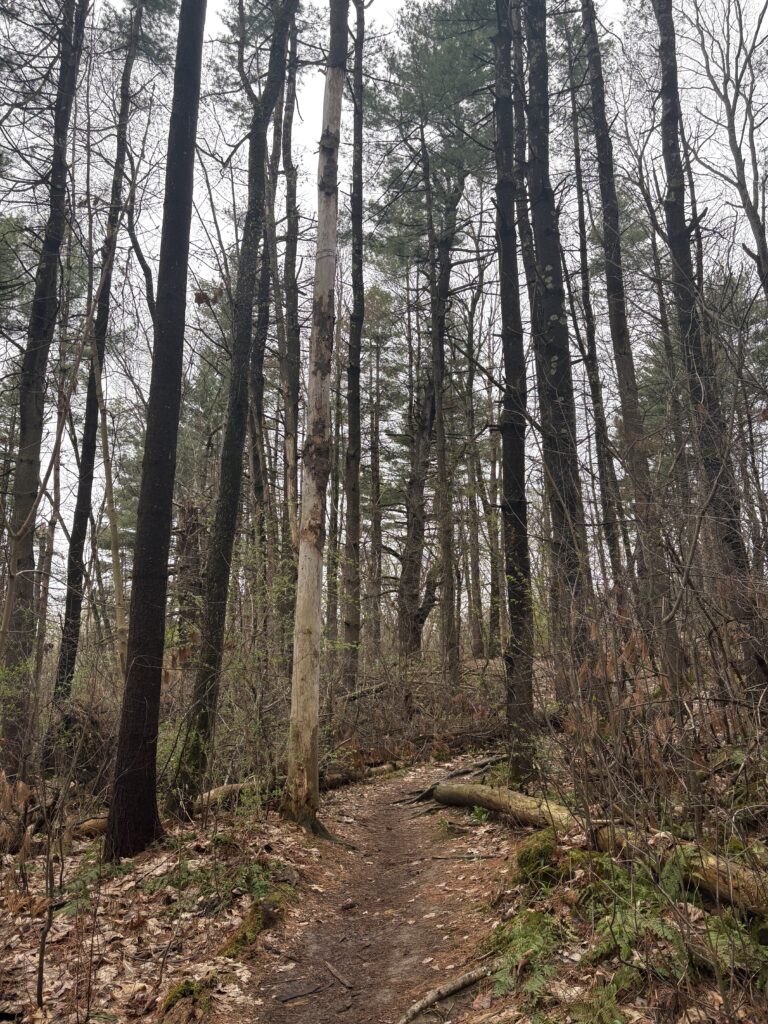
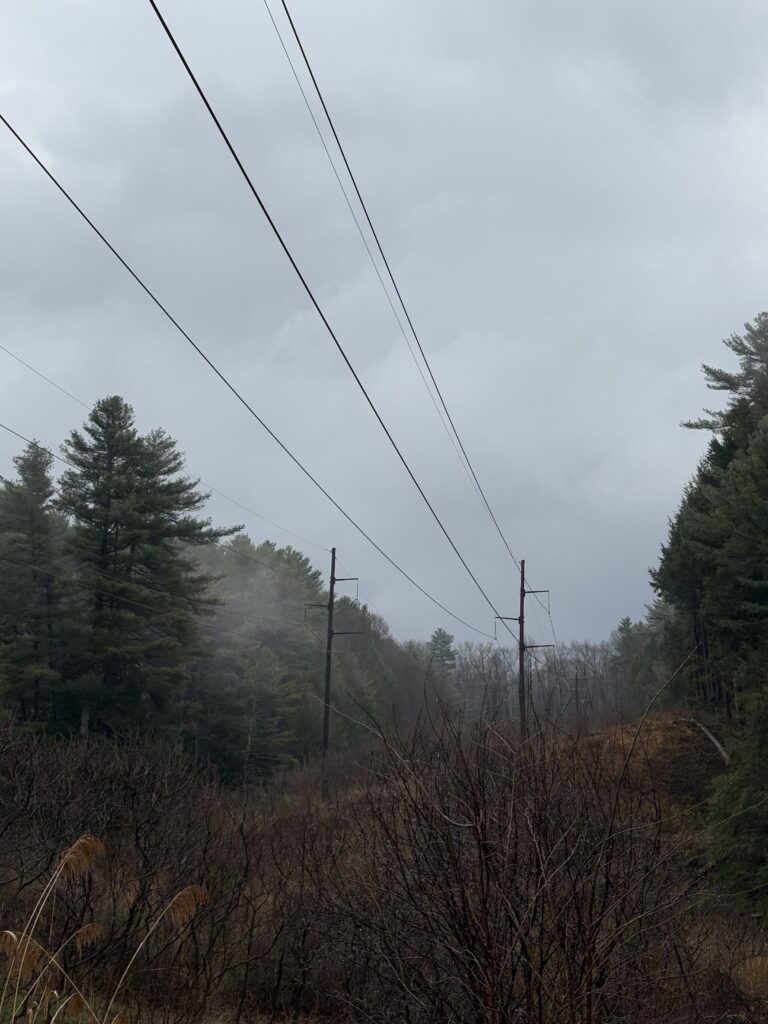
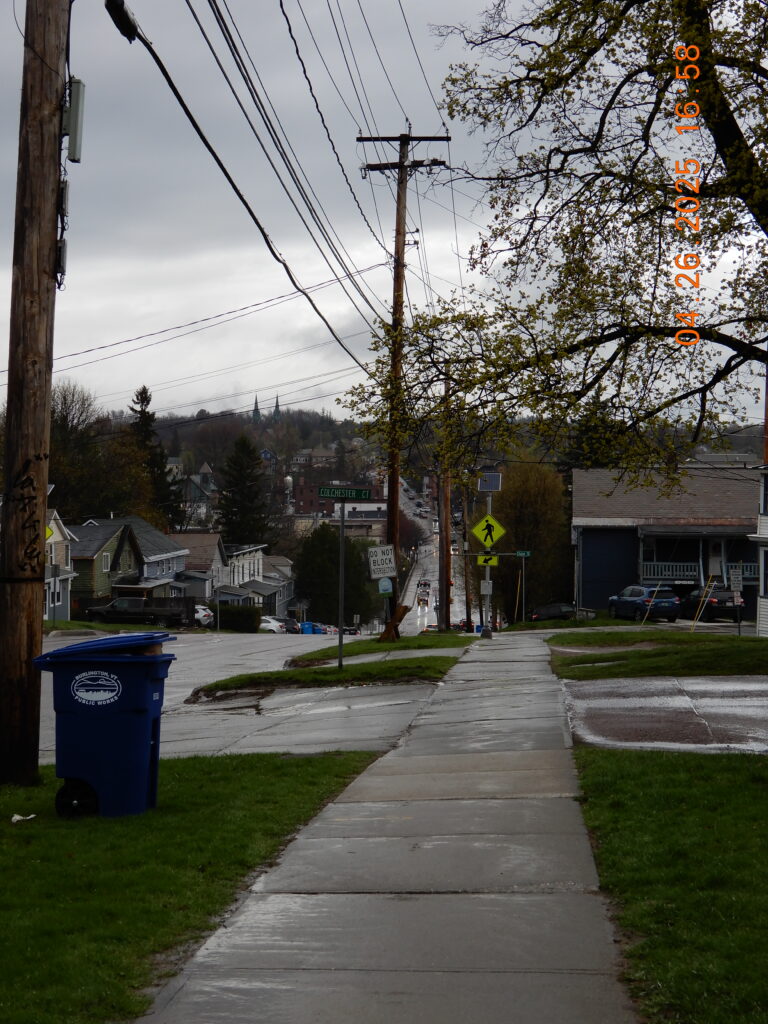
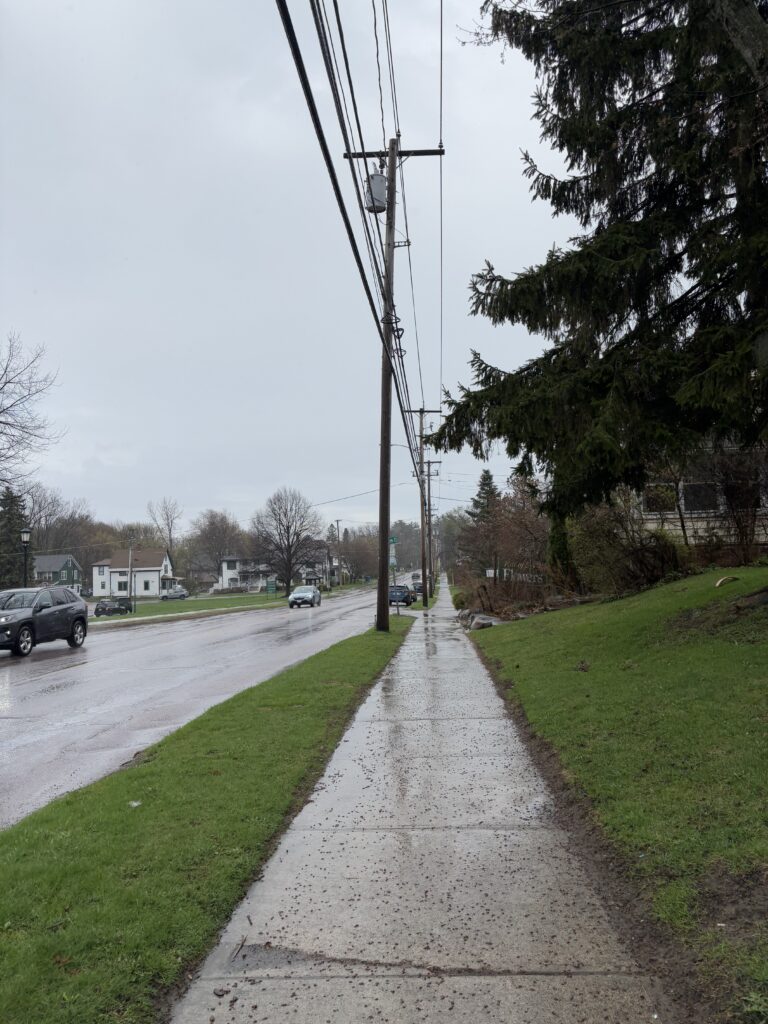
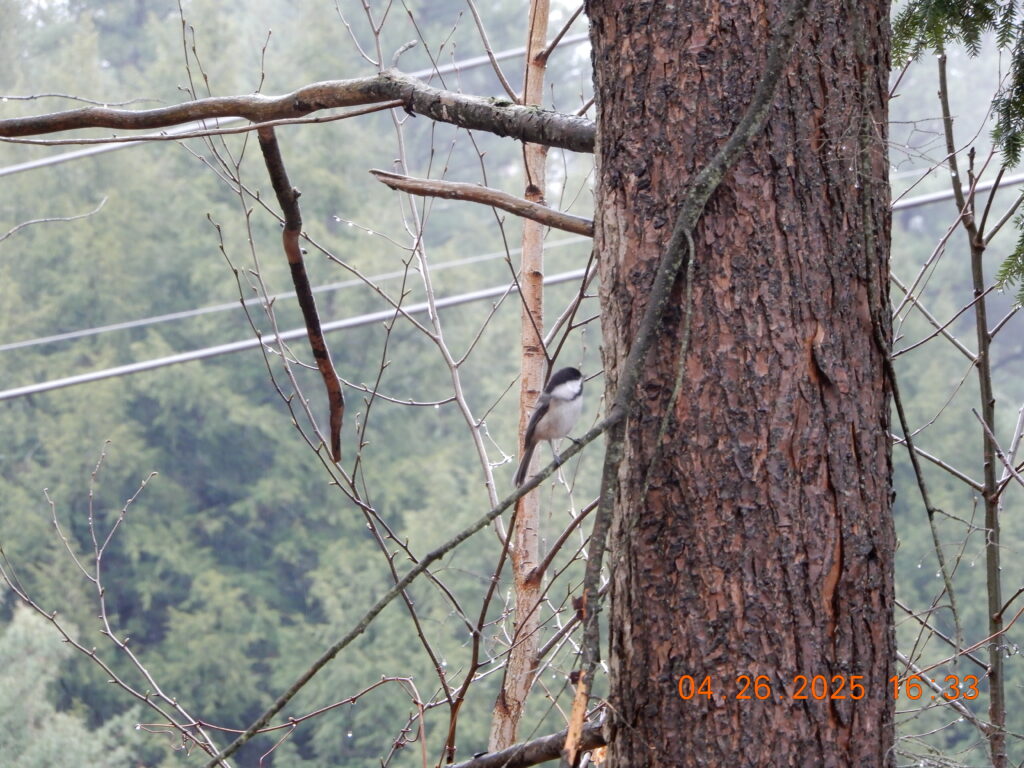
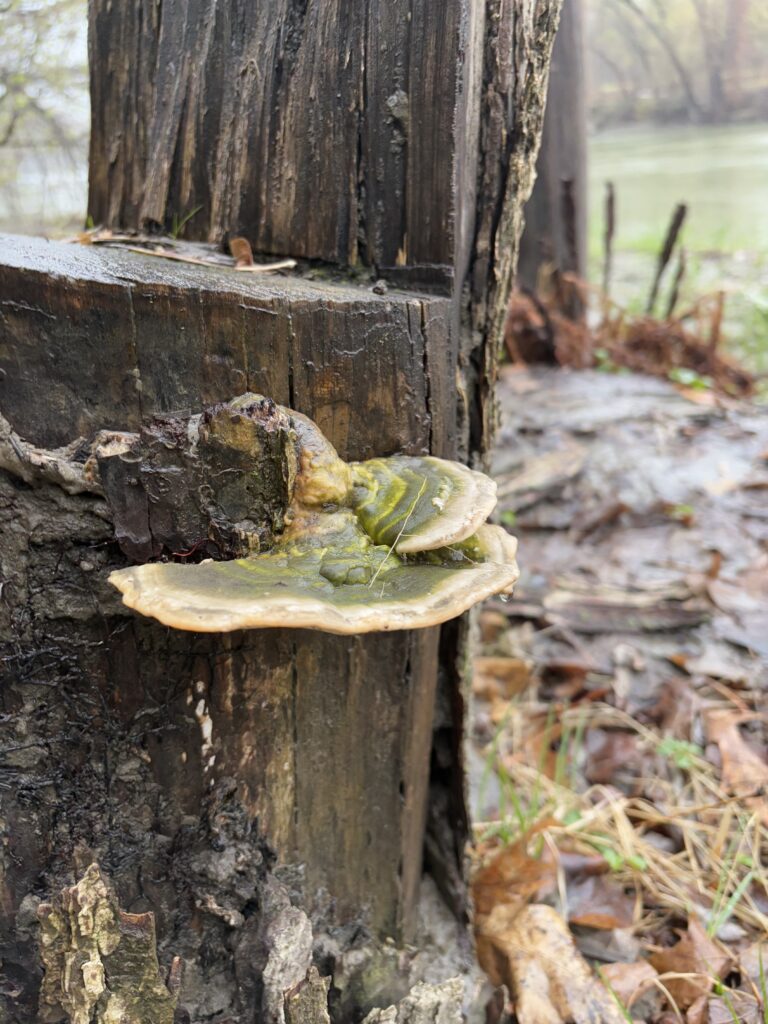
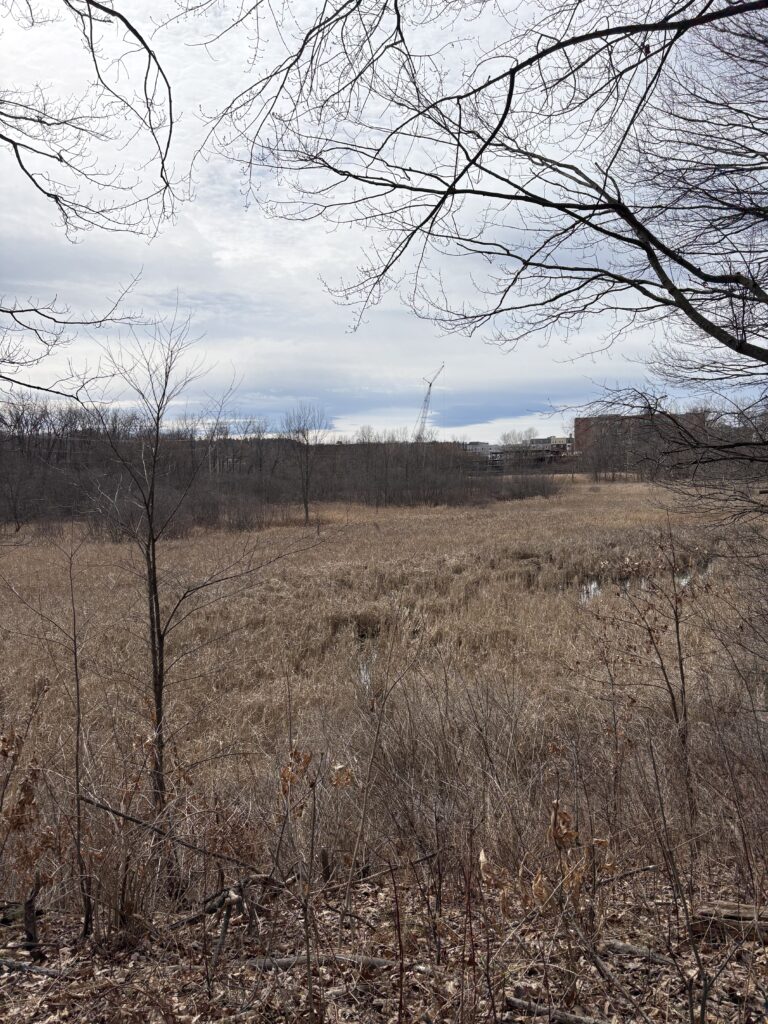
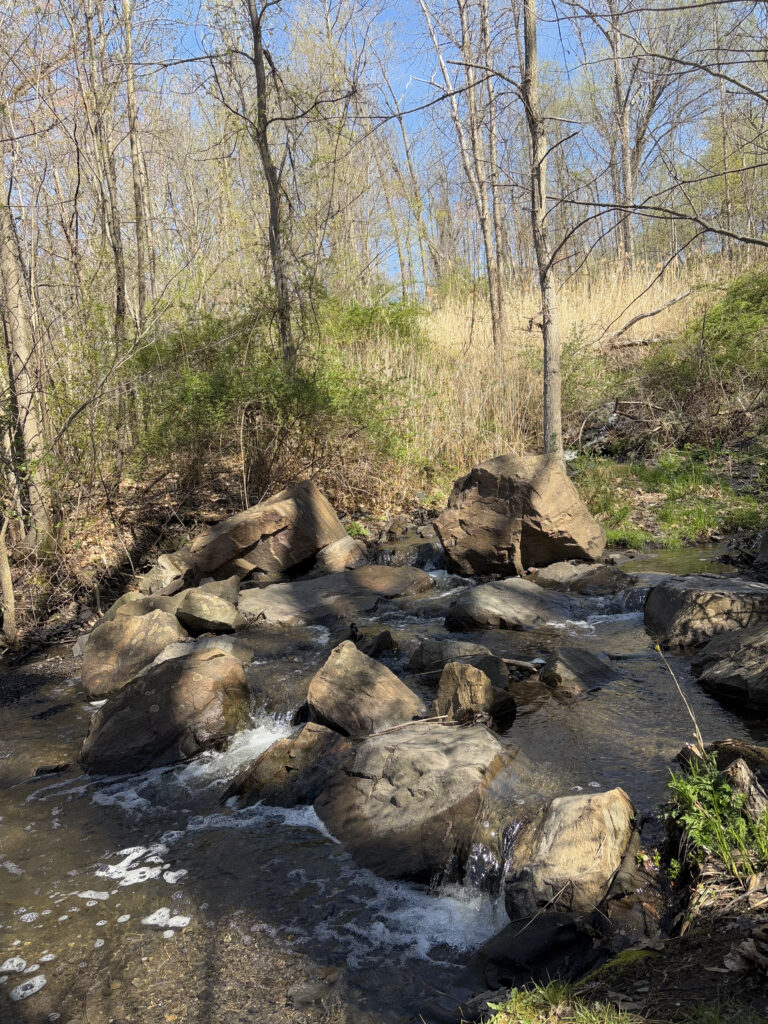
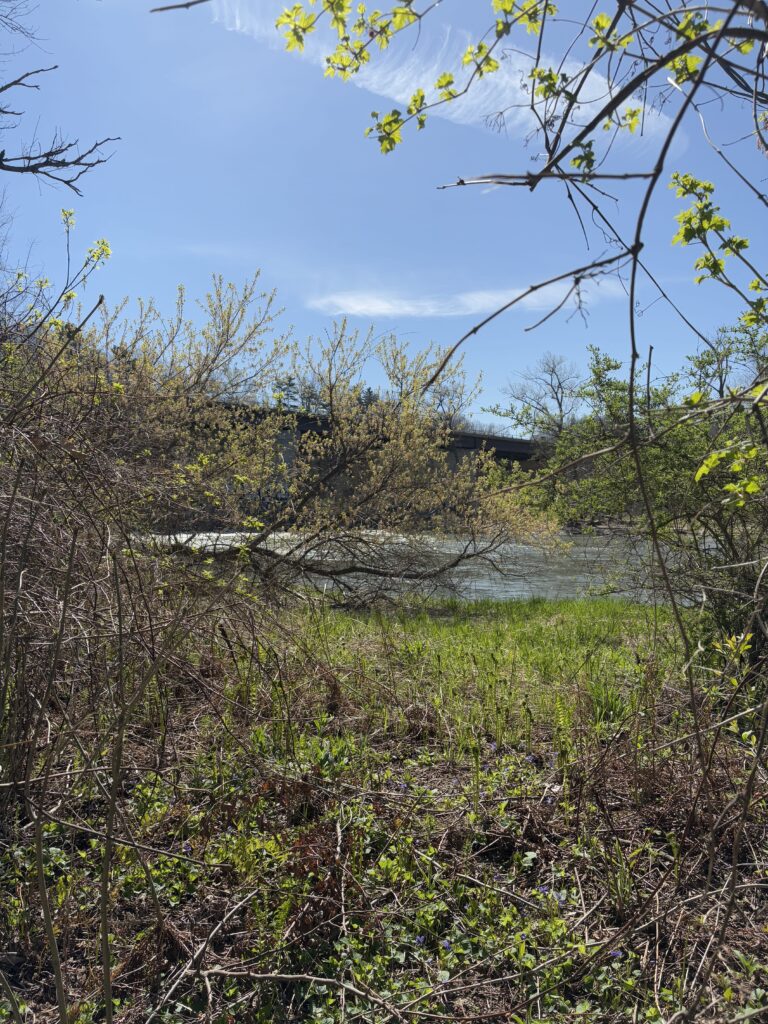
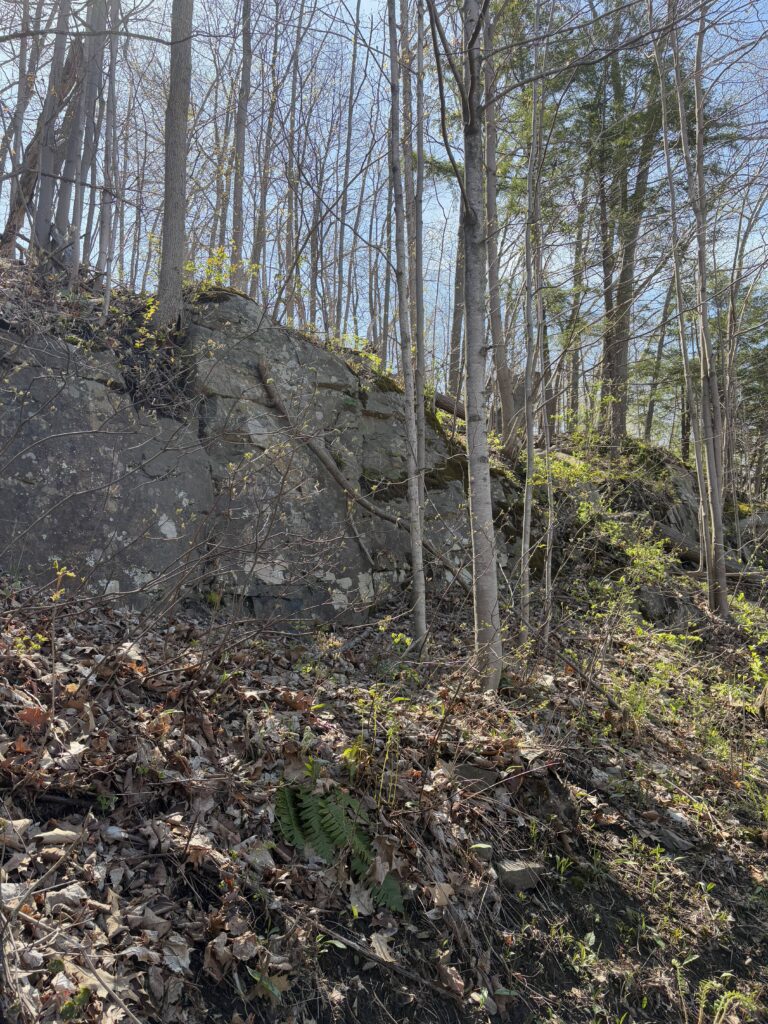
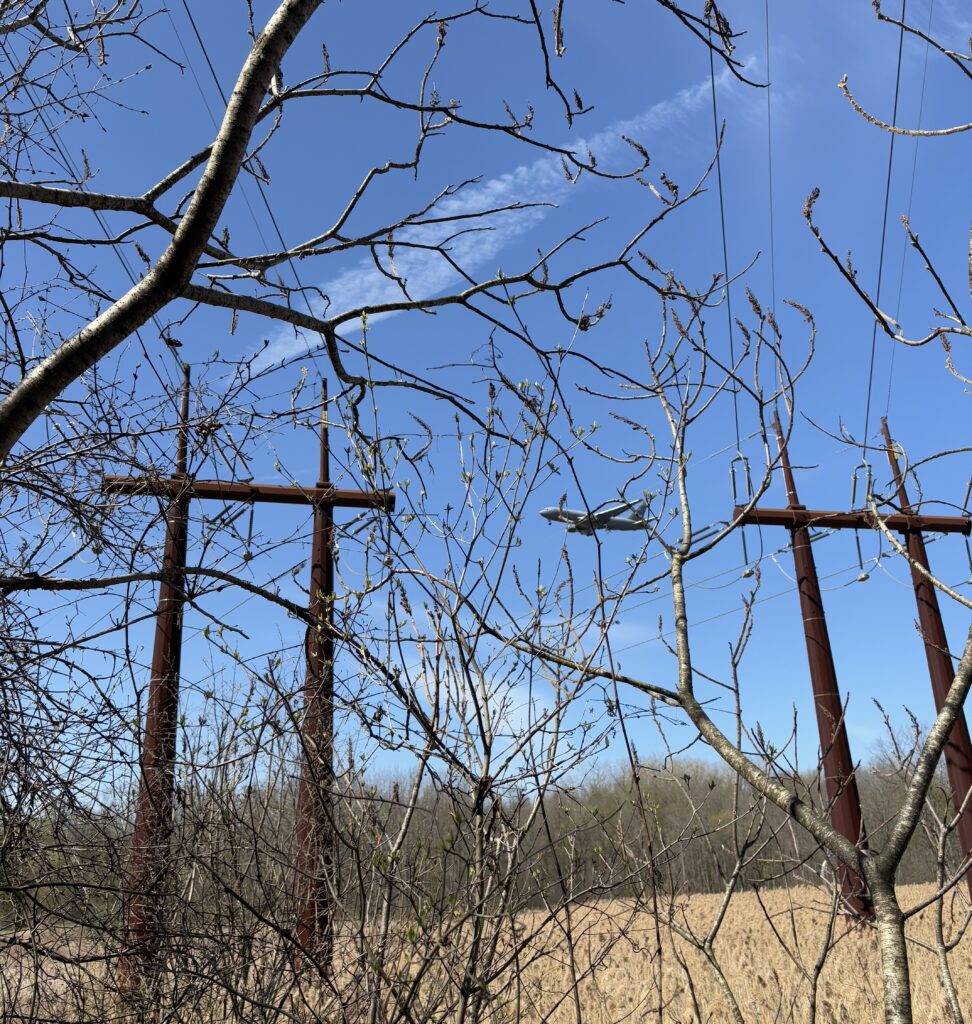
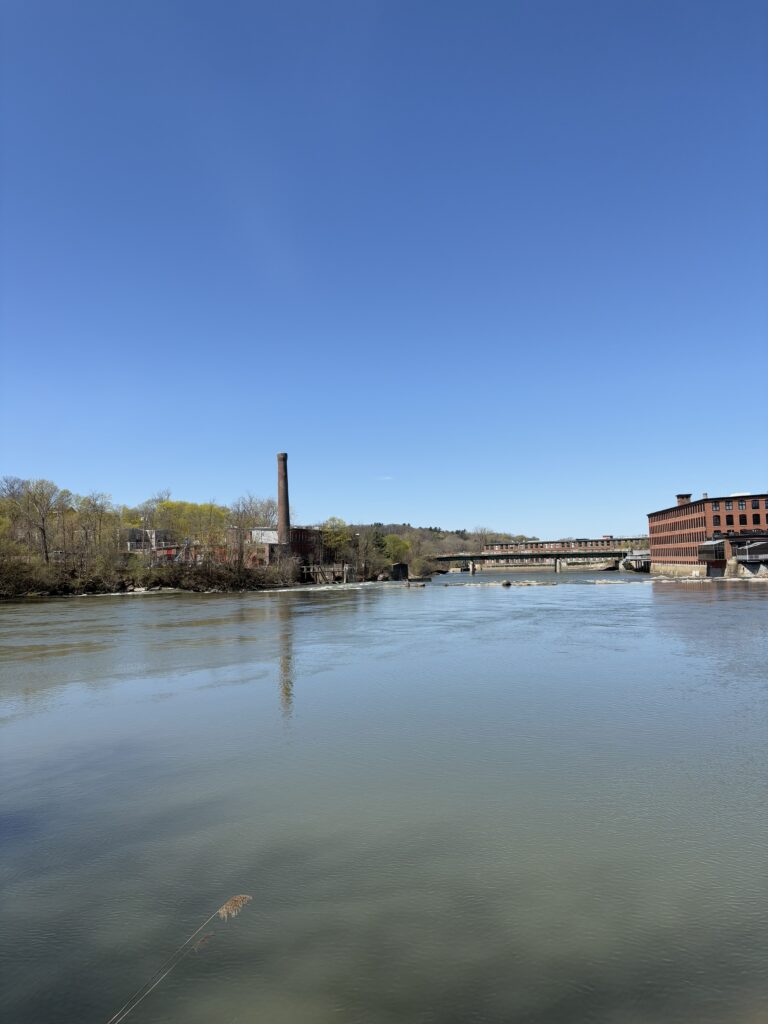
Casavant has some distinct, defining features which I have come to love. The most prominent are the powerlines which span over a portion of the park, the large wetlands which the trails perimeter, the Winooski River bank and the rocky outcrop.

The more minor features are the numerous culverts and access points, the brook which drains into the wetlands and the numerous flooded areas with small bridges.

Socio-ecological Connotations

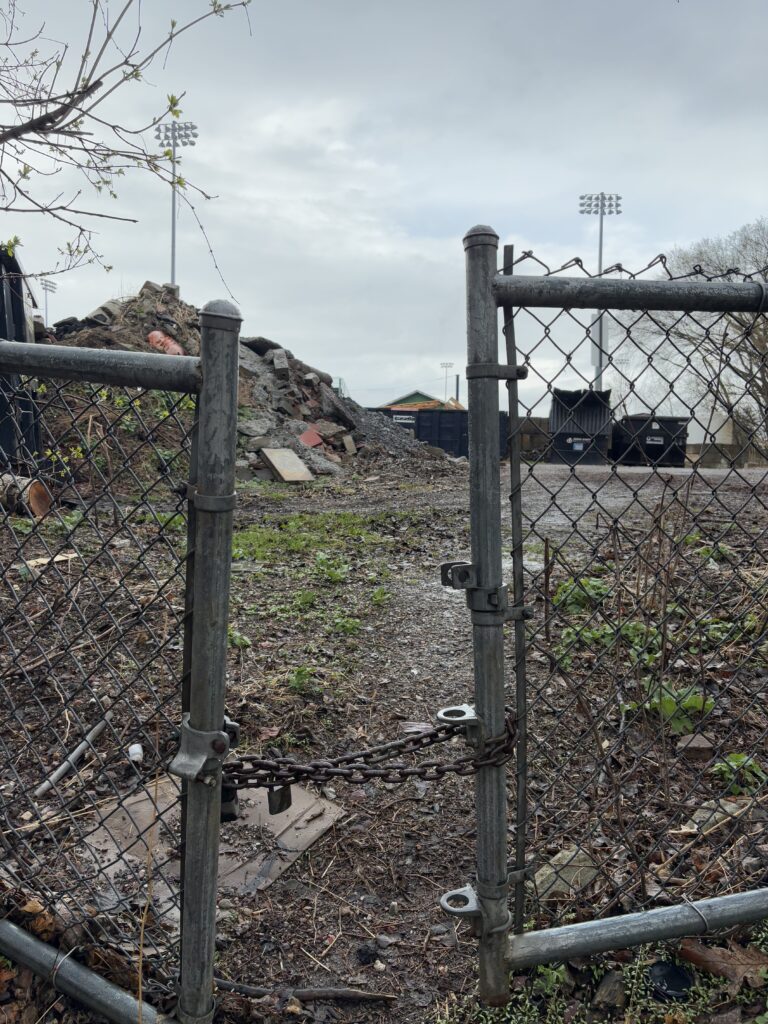
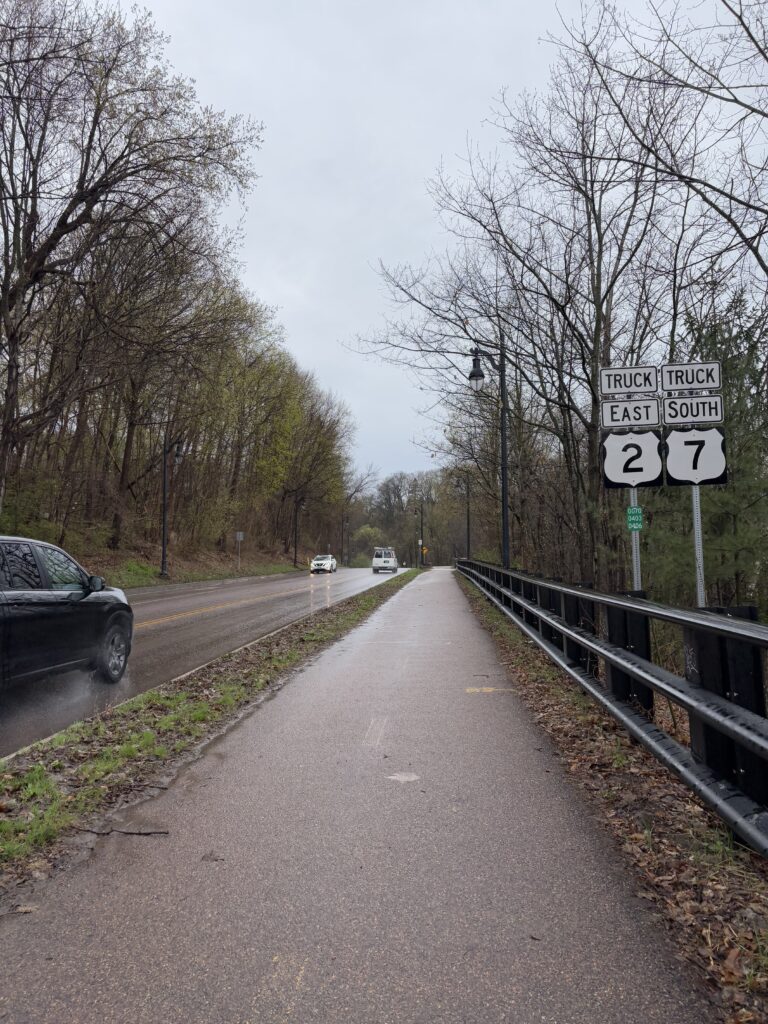
The natural area is shaped by both the natural world and urban development. Casavant Natural Area is borders the most urbanized areas in Vermont. Winooski to the north, the airport to the east, and Burlington to the southwest, the area is surrounded by developed land.

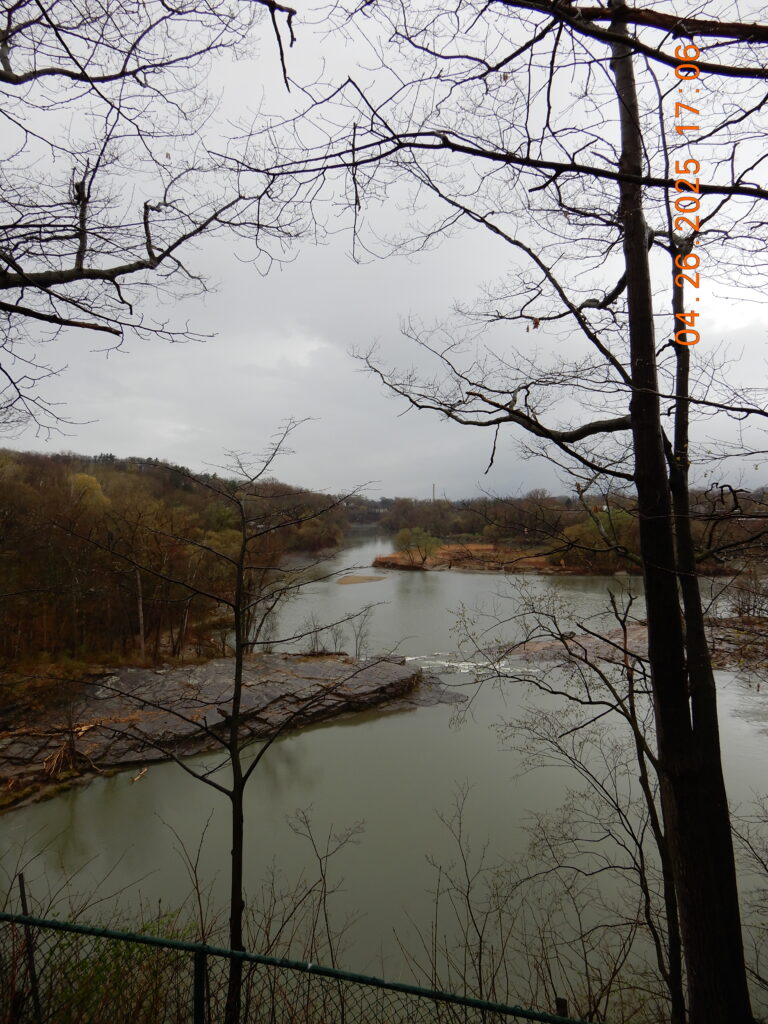
Before E Allen St. and I-89, the Winooski River shaped the land. Casavant consists of floodplain forests and vernal ponds, supplied by the Winooski’s intermittent flooding. The hiking trails run through the area’s more wooded, higher elevations.

Human intervention through the construction of roads, culverts, powerlines and housing has shaped the land to how we know it today. Culverts have eroded small valleys in the land as water drains from the roads above and large sewage access pipes jut out of the trailhead. I-89 borders 2/3 of the park and in combination with the airport, introduces significant noise pollution.

Powerlines & An Airplane

Located within Winooski, VT– a town named after the river, winoskik, Casavant offers a small representation of land stewardship and the human-nature connection, heavily emphasized in the indigenous Abenaki peoples culture. The “Onion River” flows through Casavant with little blockage among the banks on either side. As I visit this site, I remain conscious of the past land stewardship of the Abenaki and the gratitude I feel to those who came before me. While the land may only look a fraction as beautiful as it once did, it remains natural thanks to the Indigenous culture deeply rooted in the land’s history.

“Do you consider yourself a part of your place?”

I don’t usually directly insert the questions asked for these assignments into my blog, but I feel like this question deserves a section. Short answer: no, long answer:….

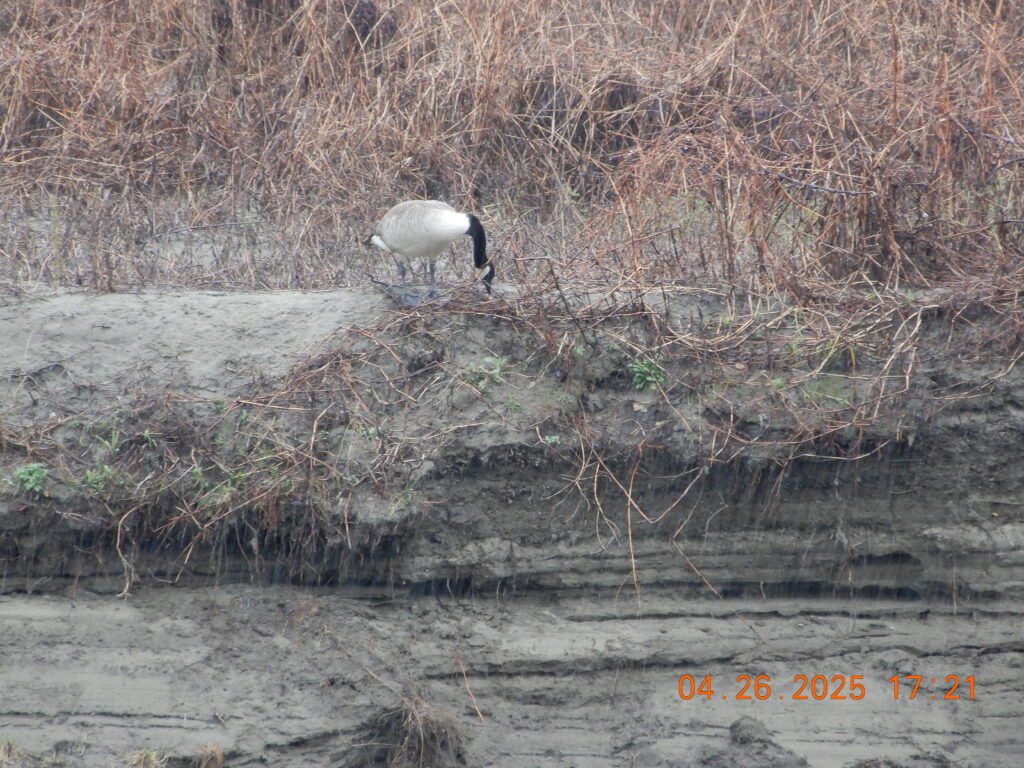
I do not feel as though I am a part of my place in the way that the mourning doves or the ferns are a part of the place. I do not feel like I contribute to the land as the streams and ponds do. I feel like a part of Casavant in the way I leave footprints like every other visitor or move sticks into the puddles to make makeshift paths. My mark is visible, if you look with intention, yet no one would know I had gone unless told. The park exists without me, but the trails do not exist without people. I do not consider myself a part of the place as an individual, as I have not contributed anything to the land other than gratitude, but I would consider myself as a collective, as the broader community of humans a part of the area.

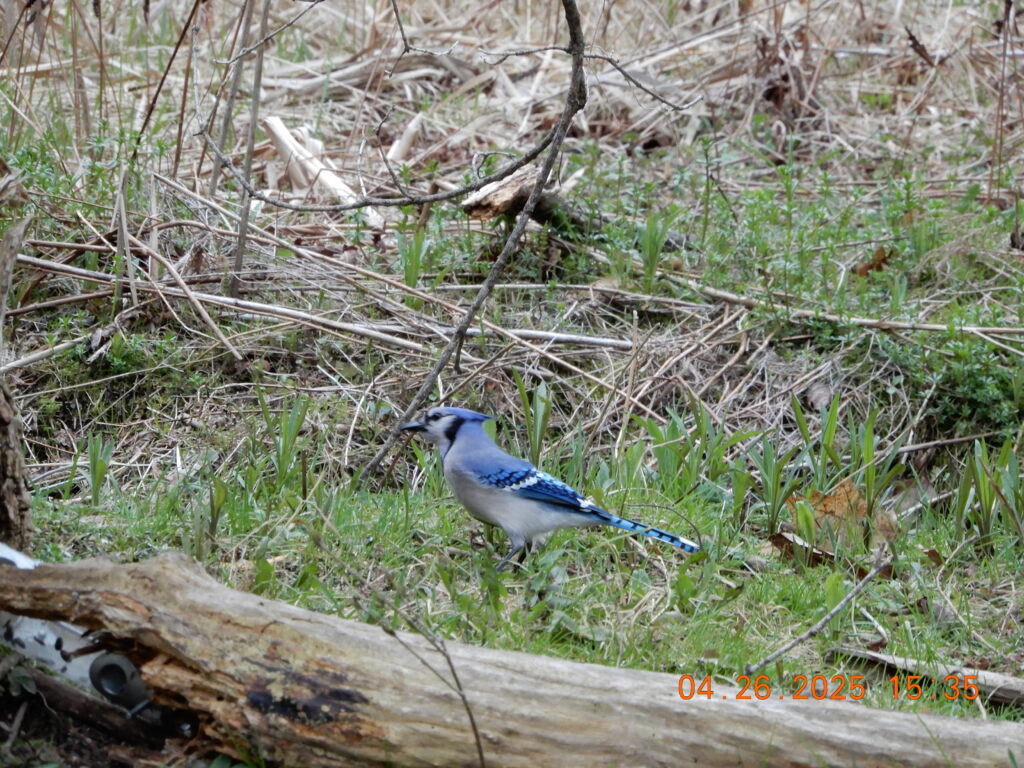
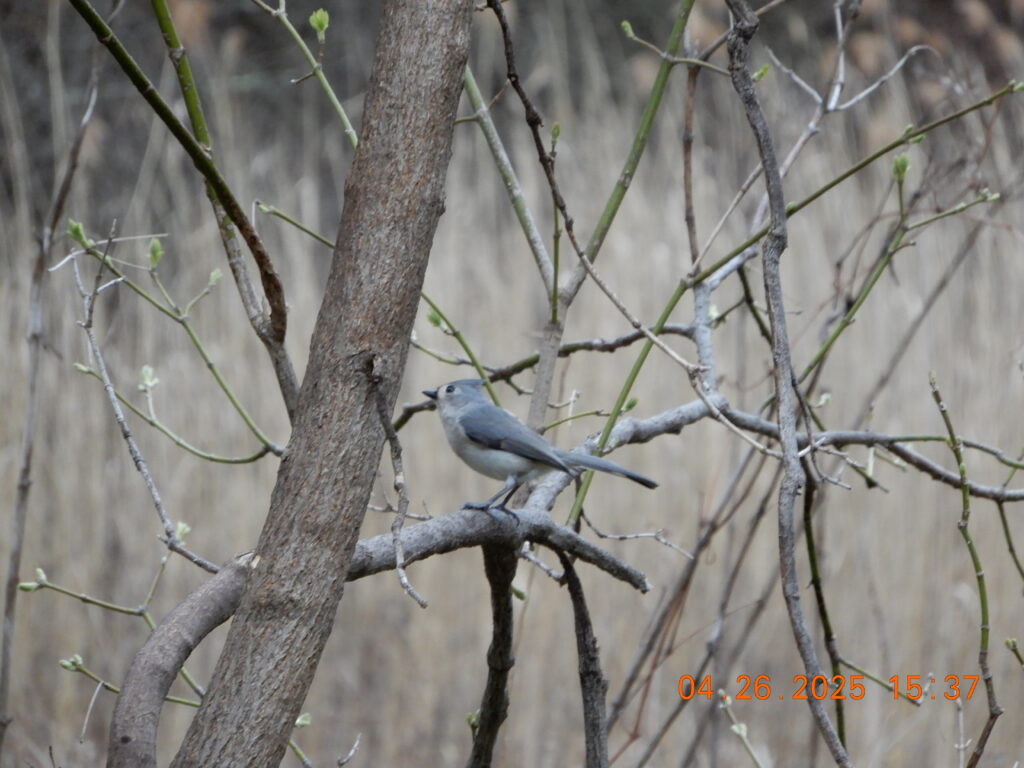
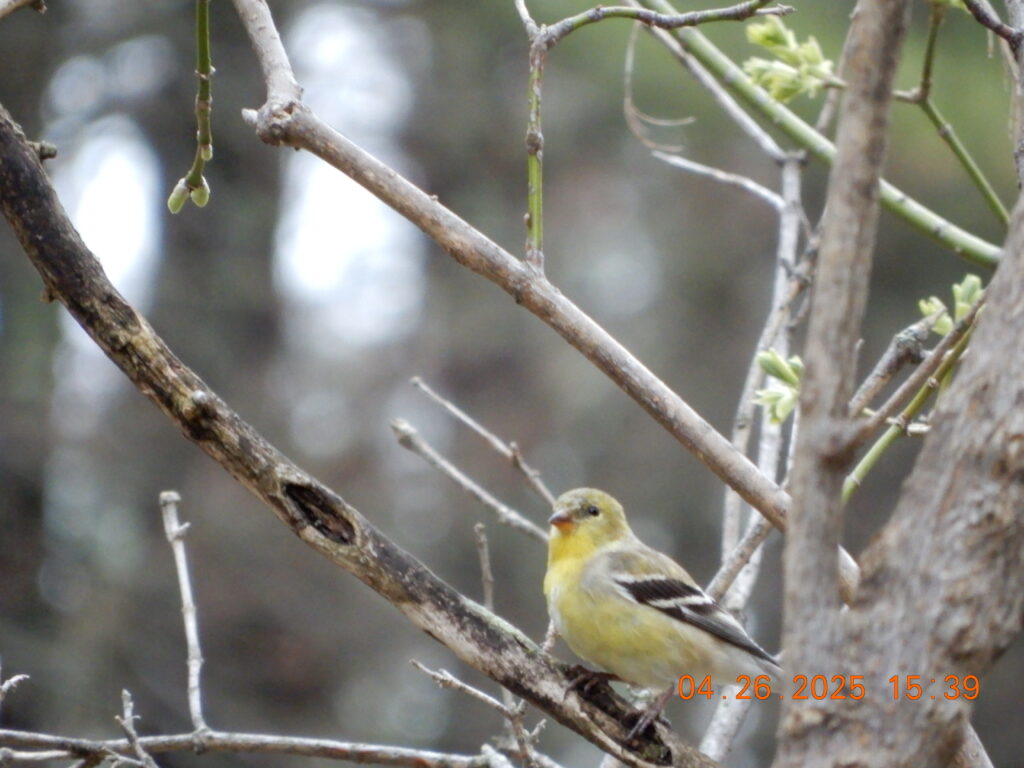
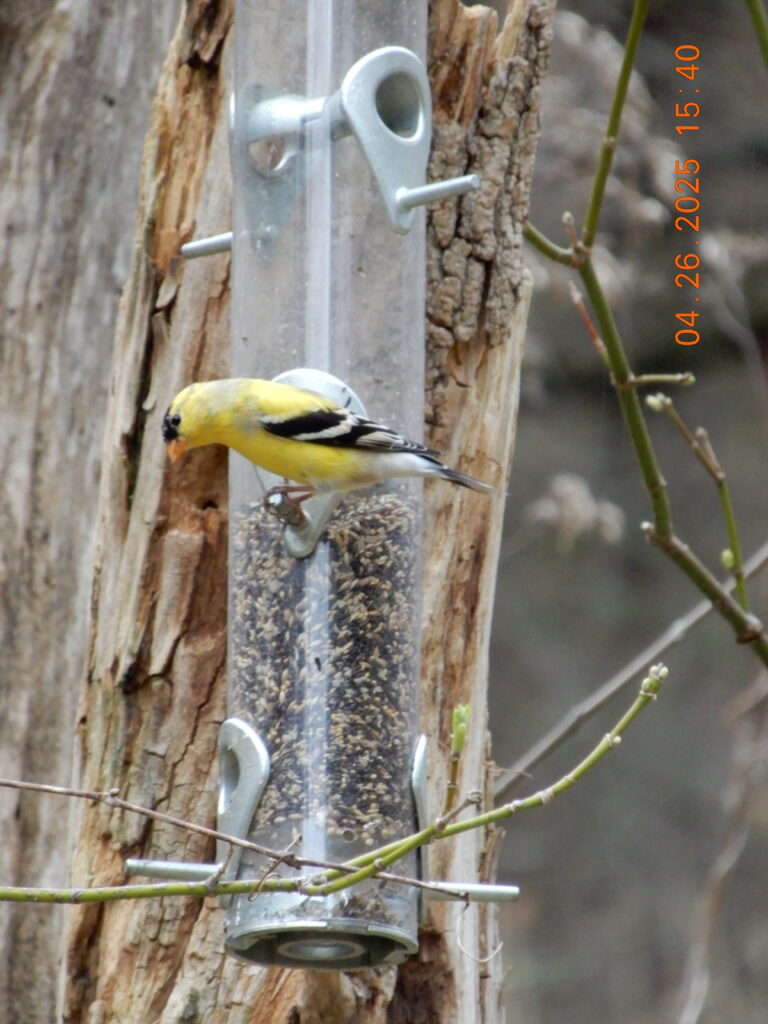
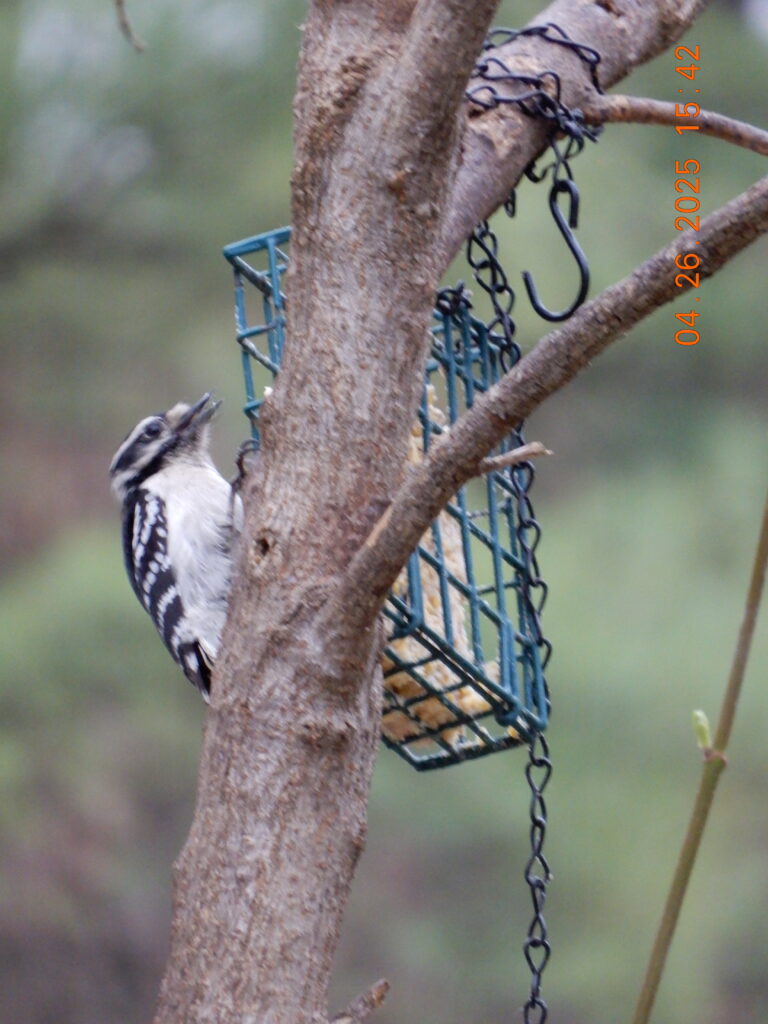
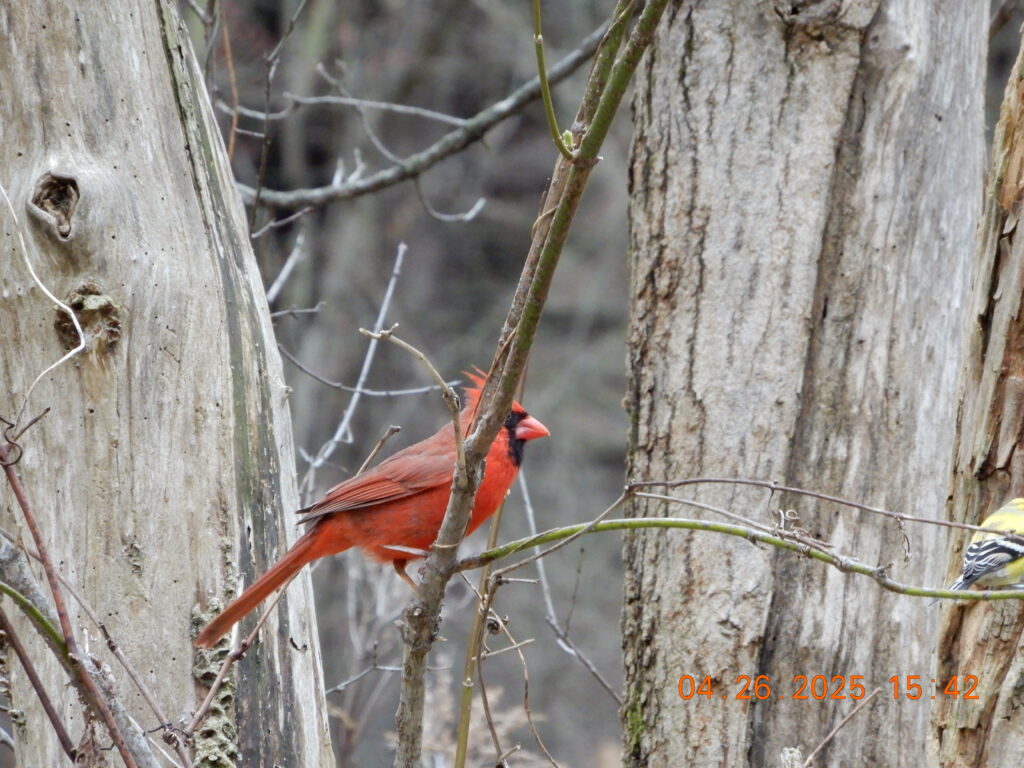
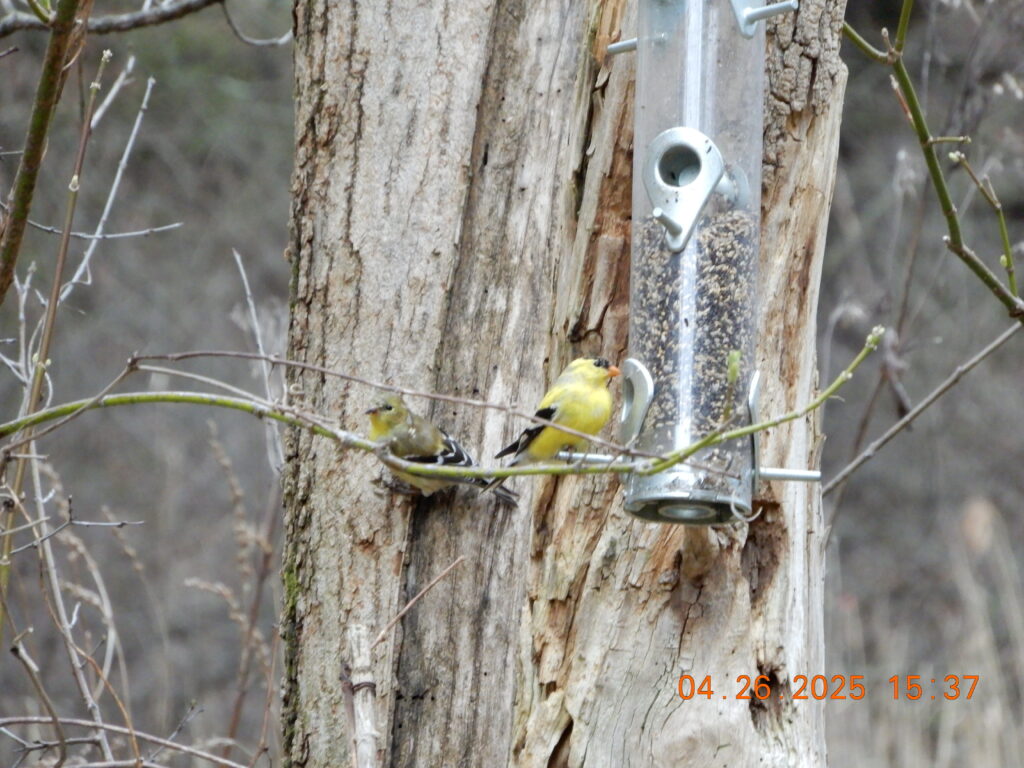
While I did not highlight all the species I photographed at Casavant during this trip, I did upload them to iNaturalist, so if you are curious about those, you can find them here.

April 26th, 2025

City Nature Challenge!

Unfortunately, the weather has not been on our side here in Burlington for going out and exploring during this year’s City Nature Challenge. Fortunately, I did not care.

I spent the better half of Saturday outside, exploring some of Burlington’s natural areas in the rain. I learned that my jacket is not, in fact, waterproof and that I love solo hiking!

I left my room at around 2:30 pm, equipped with my camera and Merlin bird ID app, and didn’t get back until 6:30 pm–give or take the 15 minutes I spent questioning my choices trying to dry myself off in a bathroom in the middle of campus. I walked just about 5 miles in total.

This is a rough estimate of my path I mapped out, I took a lot of turns and walked back and forth on trails (I got lost) in Centennial Woods so I don’t think that part of the map is accurate.

First, a quick stop at the bird feeder in between Jeffords and the Police Station!

While most of the birds were in the brush behind the feeder, I also saw some black-capped chickadees.

Centennial Woods

First stop: Centennial Woods! (Not counting the 15 minutes I stopped at the bird feeder on the side of the road)

I took a Merlin recording as I walked down the start of the trail. It picked up Dark-eyed Junco, Northern Cardinal, Merlin, Downy Woodpecker and Northern House Wren calls/songs.

I stopped at the bird feeder by the stream for a while and set up Merlin again.

After recording for around 20 minutes near the bird feeder and open area, the app picked up:

  • American Goldfinch
  • American Robin
  • Baltimore Oriole
  • Black-capped Chickadee
  • Broad-winged Hawk
  • Brown Creeper
  • Brown-headed Cowbird
  • Downy Woodpecker
  • Golden-crowned Kinglet
  • Hermit Thrush
  • Northern Cardinal
  • Pine Warbler
  • Ruffed Grouse
  • Song Sparrow
  • Tufted Titmouse
  • Song Sparrow

After spending a good chunk of time around the stream, I turned around to start to head through Centennial in the direction of Winooski. Around this time was when it started to rain a good amount. I took tons of pictures of fiddleheads as I continued to walk.

I got to the edge of the forest and had to cross this oddly unsecure fence through Centennial Field to get to the street.

The Walk to Salmon Hole

I got rerouted since AllTrails lied to me and tried to get me to walk through a wall, so I added some extra time onto the journey. Once I got onto Colchester Ave it was smooth sailing.

I heard a European Starling on the walk, which I had never heard before. Saw some squirrels, some grass lawns and bedstraw lining the bricks by the cemetery.

Salmon Hole

I had never been here before, only seen pictures, so I really didn’t know what to expect.

Off the bat, I felt a little more uneasy being alone, likely because I was further off campus and it was getting a bit darker out. It also smells very strongly of fish.

I didn’t sit at Salmon Hole itself given it was sprinkling and getting colder. I saw that there was a “River walk to Salmon Hole” trail, so I decided to give that a shot to get closer back to campus. The walk there was quite steep downhill and I did not want to take that route back up to campus.

I’m guessing the River Walk is gorgeous when it’s nicer out, it was quite spooky when I visited.

The soil was quite sandy and the area was mostly taken over by invasive plants. There were a multitude of culverts draining rusty or otherwise off-colored water into the river. There was also a large amount of garbage and litter scattered about the trail.

There were not many birds I could hear, although I did see geese and another large, scary looking bird species in hanging out on small islands in the river.

goose

By the time I got to this point in the hike, I was tired, spooked out and ready to be back to campus. The trail dumped me out on Intervale Road, which is almost directly north of central campus.

The walk back took YEARS off my life. It down poured so hard every square inch of my being was drenched.

iNaturalist Observations

Here comes the fun part….(some of) my iNaturalist observations! Click on any of the photos to be brought to the observation on my page 🙂

Centennial:

Salmon Hole:

All photos with captions should link to an iNaturalist observation page! (minus the image of the two goldfinches)

Global BioBlitz

I looked at the Global City Nature Challenge project on iNaturalist and find it super interesting that the Common Dandelion is the most observed species! I guess I assumed they were more of a regional thing but it appears they’ve been observed globally, in most regions except the most arid, hot or cold biomes. Who would have guessed!

The overall stats show around 40% of observations are plants, which makes sense, as they are stationary (for the most part) and all around us! The second highest species category, however, is insects! In my whole adventure this weekend, I wasn’t able to get a picture of a single bug, so I find that fascinating.

Looking at the current global live results, Washington DC is pretty high in the ranks. Compared to many of the cities up on that list, I didn’t think Washington DC would be 8th! I find it so cool to think all of these people are out observing the nature in their urban areas. There are almost 100,000 people participating in this, and considering how many observations just the top three cities have, I can’t image how many there truly are. This is such a lovely thing to participate in and I can’t wait for next year!

April 20th, 2025

This semester’s phenology blog has had less emphasis on a specific location, but understanding phenology from a broader perspective. Obviously, it has been quite cold for the majority of what we call “spring semester”, so there ultimately has not been significant changes in the physical characteristics of my chosen location.

This month we were asked to contribute to a broader phenology study on campus, collecting data for 5 specific trees located around UVM’s central campus.

The weather here in Vermont has been very inconsistent since the vernal equinox, likely impacting the phenophases which the trees are exhibiting and the pace at which they change phenophases.

Tree 1: Red Oak

This tree has no breaking buds, flowers/flower buds, fruit or leaves.

Tree 2: Sugar Maple

There were breaking leaf buds on this tree, however I was to tall enough to be able to see how many buds were truly breaking. It also had a few flower buds.

Tree 3: White Oak

This tree had some leaves, however they were dried out and curled up, similar to how beech trees retain their leaves in the winter. There were no other visible phenophases occuring.

Tree 4: Red Maple

While I could not see any breaking leaf buds, there were many many flower buds and flowers across this tree. They were small and red in color, but way too high for me to see any more detail.

Tree 5: Norway Maple

This tree had a decent amount of breaking leaf buds as well as some flower buds.

Through this “phenology walk” of sorts, I ultimately came to the conclusion that it is incredibly difficult to determine many phenophases while significantly shorter than a tree’s lowest branch. None of the trees had expanded leaves, and many of them had buds which were just barely breaking, if at all. The Red Maple seemed furthest along in it’s transition into spring, appearing to be fully flowering in the next week or so and shoot out leaves soon after that.

The National Phenology Network

The “NPN” is the broader network our data collection falls under. The “Nature’s Notebook” App is what we were required to use during our walk, which is NPN’s app for data collection similar to how iNaturalist utilizes recreational nature enjoyers as a tool to collect data. They have a website which has a ton of information on phenology and for this assignment we were also asked to look over a publication/news article posted by them surrounding phenology, some of which have been created using the data they’ve collected through “Nature’s Notebook”.

“Are plant and animal species responding differently to climate change?”

Phenological mismatches are increasing as the climate changes. Plants are effected at a more rapid rate, with plants’ leaf outs and blooming earlier in the year. Animals have been found to respond slower to climate change and are therefore suffering due to the changes in timing of key phenophases. This study involved information collected from a variety of databases, including the USA-NPN.

Our data collection here on campus is levels below the size of the data used in this study, but may attribute to similar ones in the future. By looking at tree phenophases on campus, we can infer things occurring at a larger scale when also considering other factors such as climate. While we may not be able to determine exactly how the plant and animal interactions have changed globally by looking at a few trees, we can help contribute to datasets which might be used for future research on climate change.