Family Dynamics Shifts and Threats to Family Timeline
This timeline (opens in new page) explores the evolving notions of what defined a family in the United States over the late 19th and early 20th centuries. Additionally, this timeline explores various “threats” that were posed to those conceptions of family, as well as how those threats were handled in different ways over time.
Threats to Families:
Engagement in Agriculture (1900)
The maps and figures below give a visual representation of the impact of child labor, specifically in the agricultural industries, on a child’s schooling in the year 1900. The regions with a high concentration of family farms, which tend to be the more rural areas, correlate with the areas with the highest illiteracy rates of people over the age of 10. This is significant because these are the same states with few to no laws providing protection for working children (Cope, 2019). This is a threat to family dynamics as the “childhood” is somewhat abbreviated by expectations of work.
https://www.socialexplorer.com/b6e5174d61/view
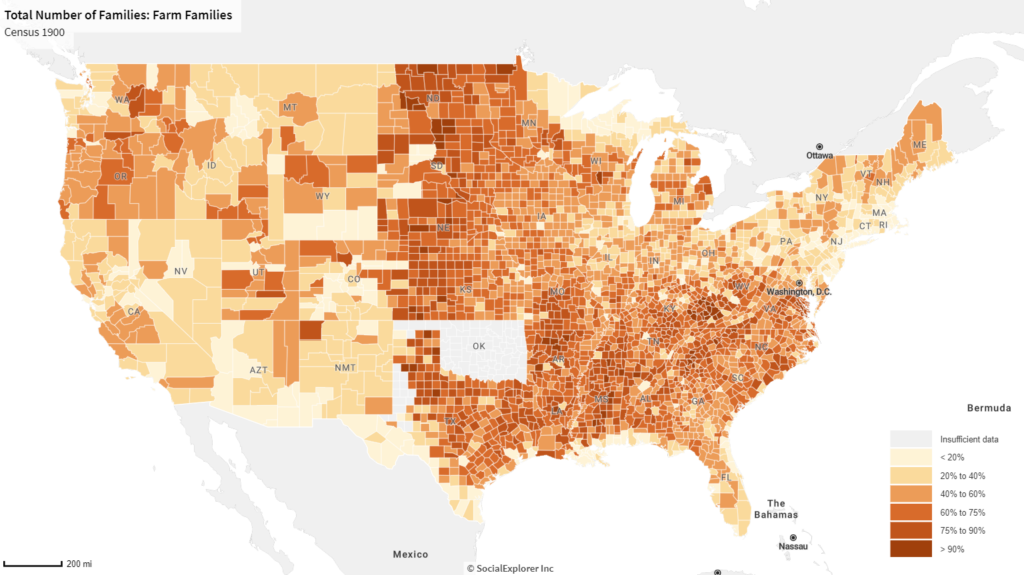
This map shows the percentage of farm families in the United States in 1900. The area from the mid-west to the mid-Atlantic (Arkansas, Tennessee, Mississippi, North Carolina and South Carolina) can be seen having the higher overall percentage of farm families spanning the longest distance. It is worth noting the sheer volume of farms in the United States as of 1900.
https://www.socialexplorer.com/411407ab1d/view
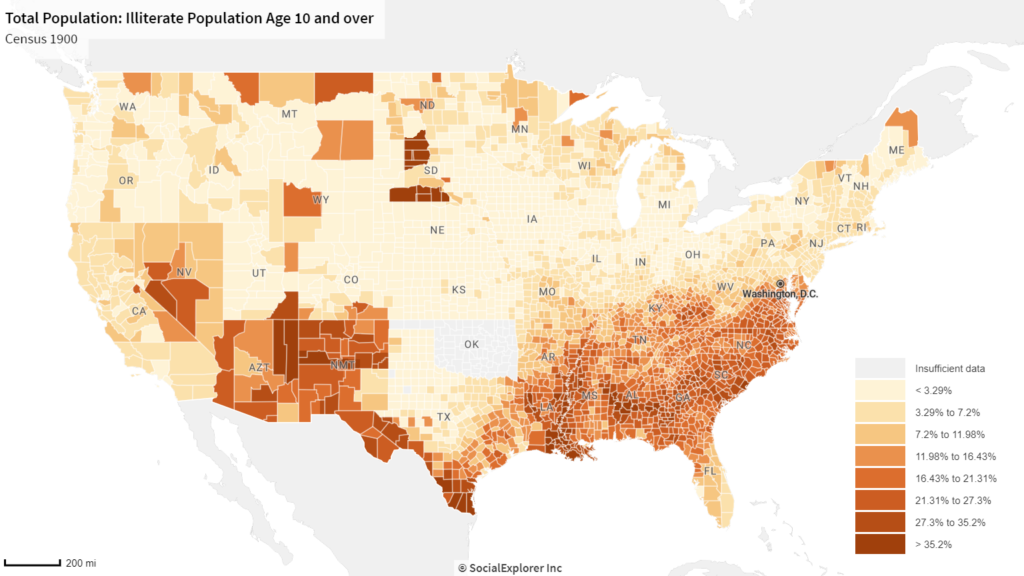
This map indicates that the south-east region as well as the states of Arizona, New Mexico and parts of Texas and Nevada had the highest percentage of illiterate people over the age of 10 in their population. The pockets of high illiteracy in the Dakotas and the Southwest were likely home to Native Americans at this time and the Southeast had high concentrations of poor Black families, so the racial pattern suggests deep educational divides. This is significant because people aged 10 and over should have some level of literacy if they have had schooling of any sort.
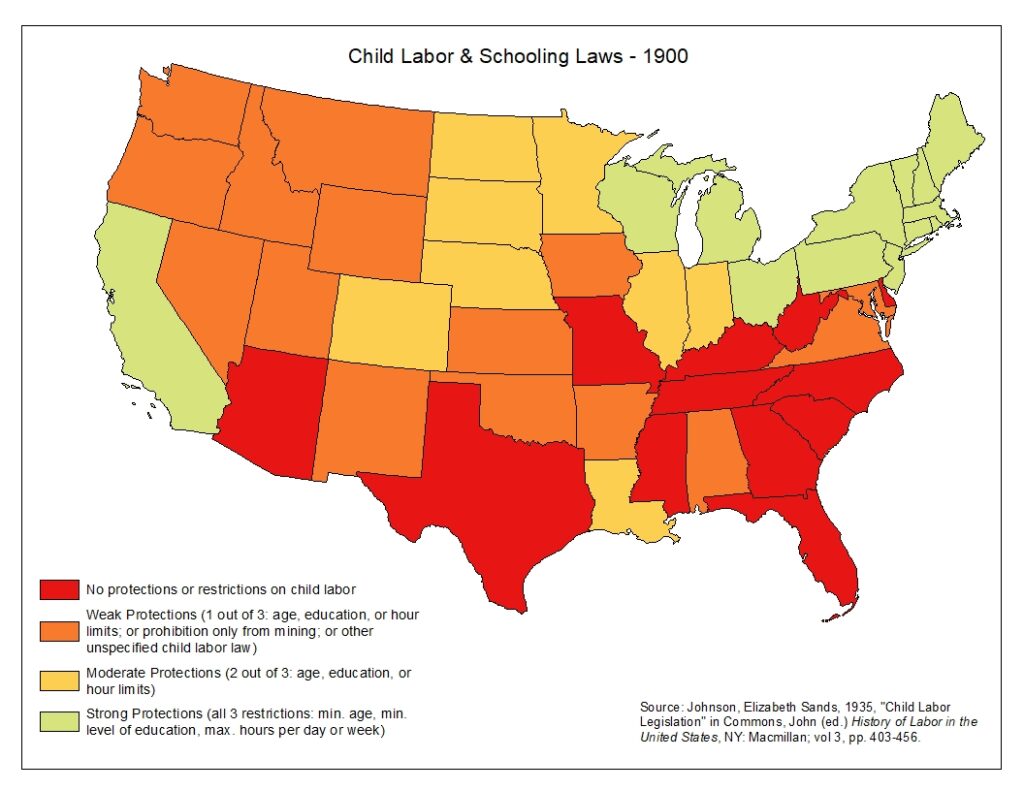
The above map correlates with the previous map as it shows that Arizona, Texas and the states in the south-west have “no protections or restrictions on child labor”. This matches up with illiteracy levels in the states. We can conclude that a lack of policies and laws regarding children’s labor leads to a low school attendance/schooling rate and subsequently higher illiteracy rates on a state’s adult population.
United States Department of Labor Children’s Bureau (1933) Child Labor: Facts ad Figures. Washington: United States Government Printing Office. https://www.mchlibrary.org/history/chbu/20648-1933.PDF
This chart from 1933 shows the proportion of children ages 14 to 15 engaged in agricultural and non-agricultural occupations in each state, reiterating the information on the previous maps. Mississippi, Alabama, South Carolina, Tennessee and Texas all have large proportions of their child population working in the agriculture industry. This correlates to the states’ laws on child labor regarding restrictions and protection (Cope, Forthcoming). Mississippi had no restrictions in 1900, and the illiteracy rate among those 10 years old and over was one of the worst in the country at the time.
Parenthood and Mothering