
April 26, 2025 2:15 pm
This weekend I participated in the USA National Phenology Network’s Nature’s Notebook program by logging observations of the phenological changes of trees on UVM’s campus. The National Phenology Network (NPN) is an organization that works on a national scale to collect, organize, and interpret phenological data. Organisms go through annual patterns of change that can be observed as distinct phenological phases. Collecting information such as when certain species emerge from hibernation, when eggs are hatching, or when trees start blooming helps us determine when organisms are entering different phenophases. By keeping track of when these events happen and comparing it to past trends, we can tell a lot about the organism’s relationship to its environment and changes in climate. Through the Nature’s Notebook app, observers can contribute by documenting their observations of certain animals and plants. I was assigned to make observations of 5 particular trees on UVM’s campus on April 26.

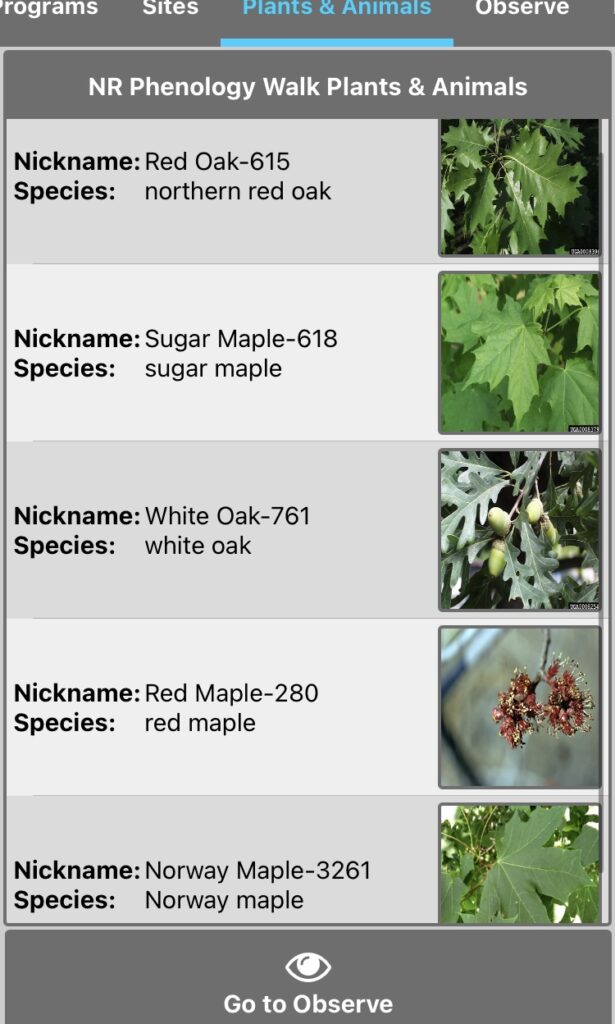
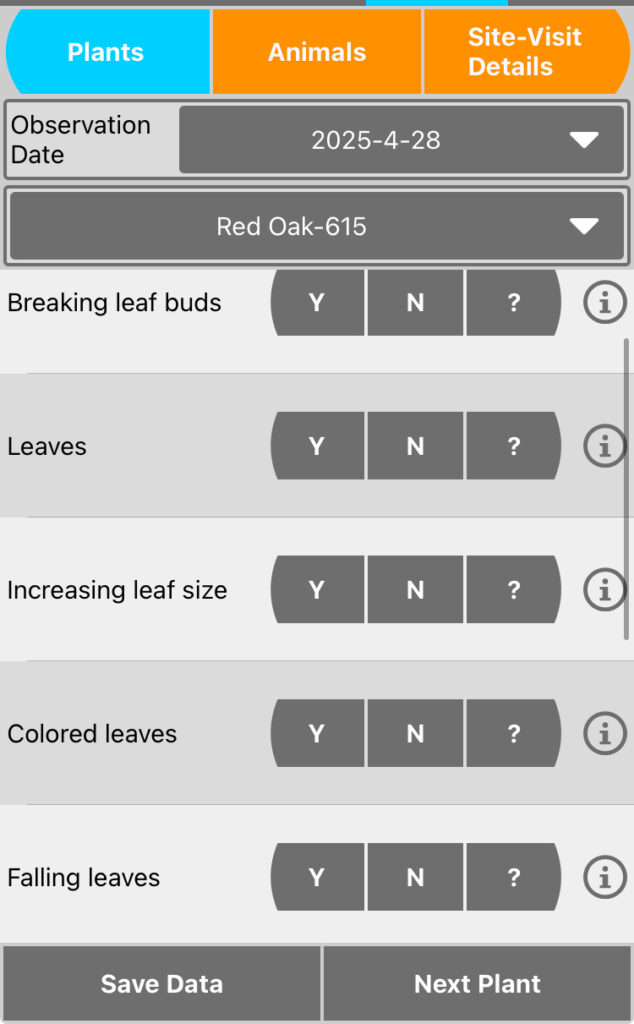
I observed a sugar maple, red maple, Norway maple, red oak, and white oak. Each tree had a corresponding number that was indicated by small metal tags on the trunks. I had to estimate information about each tree such as what percentage of buds were breaking and how many leaves were falling. I found it a little difficult to make these estimate, particularly for the larger trees. Overall, I felt the trees were farther behind with their growth than I would have expected. Most of them had at least some amount of opening buds, but only one had begun to flower. There was not a ton of new lead growth on any of the trees. The white oak still had many colored leaves hanging on from the fall. The different trees appeared to be going through different phenophases. For example, the maples generally seemed to be “farther ahead” than the oaks.
Below are screenshots from Nature’s Notebook showing the five trees I was to observe and the kinds of questions asked in order to track phenological phases.
As I mentioned before, the National Phenology Network uses data such as what I collected to compare current seasonal patterns to those observed at the same time of year in the past. For example, we can check if red maples are budding at a “normal” time in when compared to last spring. The NPN so far has found that spring (measured through phenological changes) has been arriving earlier than average in some areas of the US and later in others. For Burlington, Vt, spring is about one day late. The data is also used to make predictions. The NPS constructs Status of Spring maps which forecast when certain phenological indicators such as first leaf of first bloom should arrive to different parts of the United States. These maps are not limited to plant life. One map forecasts when emerald ash borer beetles will emerge around the country. By keeping a close record of phenological patterns, we can better understand the way climate changes are impacting species’ behavior and possibly be more prepared for future changes.
Follow the links below to learn more about the NPN or explore some of these maps