
Making a horizontal stacked bar graph in Stata
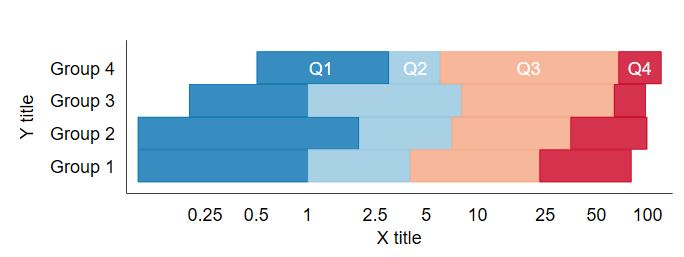
I spent a bit of time making a variation of this figure today. (The data here are made up.) I’m pleased with how it came out. I first tried to use the -graph bar, horizontal- command, but it didn’t give me as much customization as -twoway graph rbar…, horizontal-. I think it looks pretty slick.
Start with an Excel file
I made an Excel file called stacked bar graph data.xlsx that I saved in the same folder as a .do file. I closed Stata and reopened that .do file from Windows explorer so that Stata set the working directory as the same folder that contains the .do file. More importantly, it set the working directory as the same folder that also contains the Excel file.
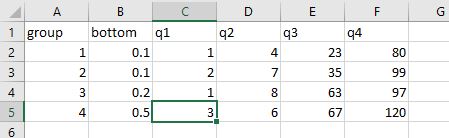
Group is the number of the individual bars, bottom is the bottom of the first segment of a bar, q1 is the top of the first segment of each bar. The rest should be obvious. I made this for quartiles, hence the q1-4 names. You can tweak the numbers by editing the Excel file, hitting save/close, and rerunning the .do file.
Make sure that you save and close Excel before running the .do file or the .do file won’t run and you will be sad.
My .do file for making this horizontal stacked bar graph
Here’s my code! I hope it’s useful.
********************************************************************************
******************************IMPORT DATA HERE**********************************
********************************************************************************
import excel "stacked bar graph data.xlsx", firstrow clear // make sure that excel
//                                                           is closed before you
//                                                           run this script!
destring, replace

********************************************************************************
******************************CODE STARTS HERE**********************************
********************************************************************************
capture ssc install scheme-burd, replace // this installs nicer color schemes
// see the schemes here: https://github.com/briatte/burd
set scheme burd4

graph twoway ///
(rbar bottom q1 group, horizontal) ///
(rbar q1 q2 group, horizontal) ///
(rbar q2 q3 group, horizontal) ///
(rbar q3 q4 group, horizontal) ///
, /// if you modify this file and it stops working, check the placement of this comma
xscale(log) /// make the x axis log scale
xla(0.25 "0.25" 0.5 "0.5" 1 "1" 2.5 "2.5" 5 "5" 10 "10" 25 "25" 50 "50" 100 "100") ///
yla(1 "Group 1" 2 "Group 2" 3 "Group 3" 4 "Group 4") ///
ytitle("Y title") ///
xtitle("X title") ///
text(4 1.2 "Q1", color(white)) /// first number is y second is x.
text(4 4.3 "Q2", color(white)) ///
text(4 20 "Q3", color(white)) ///
text(4 90 "Q4", color(white)) ///
legend(off) /// no legend, aspect is the shape of the figure. 1 is tall and thin.
aspect(.25)
//
// export the graph as a PNG file
graph export "stacked graph.png", replace width(2000)
// graph export "stacked graph.tif", replace width(2000) // in case you want as a tiff